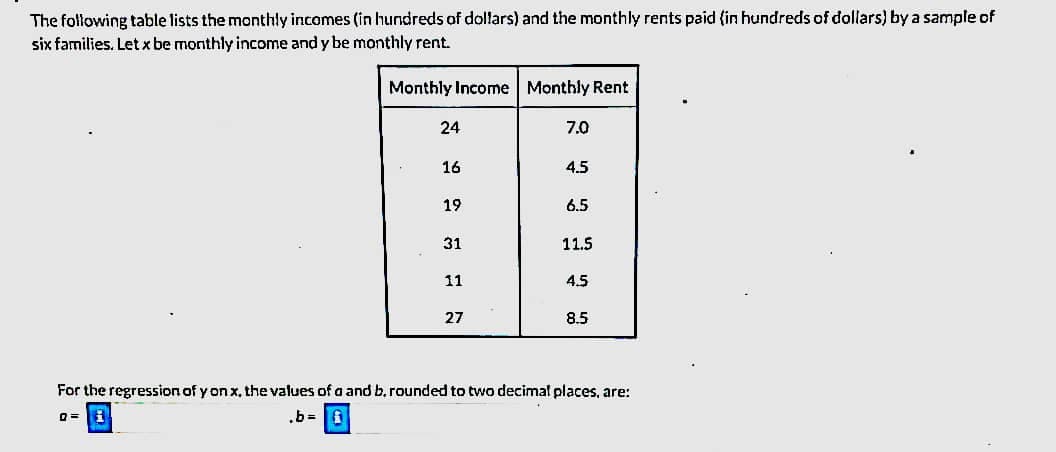
The following table lists the monthly incomes (in hundreds of dollars) and the monthly rents paid (in hundreds of dollars) by a sample of six families. Let x be monthly income and y be monthly rent. Monthly Income Monthly Rent 24 7.0 16 4.5 19 6.5 31 11.5 11 4.5 27 8.5 For the regression of y on x, the values of a and b. rounded to two decimal places, are: b= 1


Q: The amount of coffee that people drink per day is normally distributed with a mean of 16 ounces and…
A:
Q: fc(c) = | 16| fA,B(cb, b) db. v that if Z ~ N(0, 1) and Y ~ x²(n) with Z an Z T = ~ t(n).
A: *Answer:
Q: A shoe store developed the following estimated regression equation relating sales to inventory…
A:
Q: A sales manager collected the following data on annual sales for new customer accounts and the…
A: Regression equation =y = 82.1+4.6x
Q: At a bakery company restaurant, the probability that customers will order desserts without cheese is…
A: Givenprobability that customers will order desserts without…
Q: The temperature distribution of city C has a population mean u = 11.17. You randomly select 28 days…
A:
Q: 6. Hours Slept 6.5 8.25 7.5 7.25 7.25 7.5 6.5 7.75 5.25 7.75 7 6.75 6.25 7.5 7 7.25 6.75 7.5 6.75 6…
A: Solution-: Given data of hour slept. We want to find, (a) n=?,x¯=?,s=? (b) 5 number summary (c)…
Q: A genetic experiment with peas resulted in one sample of offspring that consisted of 431 green peas…
A: The random variable yellow peas follow normal distribution. We have to construct 95% confidence…
Q: A bus comes by every 13 minutes. The times from when a person arives at the busstop until the bus…
A: As per guidelines expert have to answer first question three subparts only dear student please…
Q: Use the standard normal table to find the area to the left of z=−0.34. The area to the left of…
A: Given that. X~N( 0 , 1 ) μ=0 , ?=1 (for standard normal distribution) Z-score =( x - μ )/?
Q: The results of the total test scores of 60 test participants as new employees of a hardware company…
A: Given information: 120, 120, 125, 130, 140, 145, 145, 150, 160, 160, 165, 170, 172, 175, 175, 180,…
Q: Nationally, patients who go to the emergency room wait an average of 7 hours to be admitted into the…
A: From the provided information, Sample size (n) = 14 Sample mean (x̄) = 7.1 Standard deviation (s) =…
Q: The recidivism rate for convicted sex offenders is 15%. A warden suspects that this percent is…
A: The level of significance is 0.10.
Q: A study was conducted on biometric facial recognition. A face recognition app was known to correctly…
A: We have given that p = 94% = 0.94 n = 300
Q: Someone is generally a 70 percent free throw shooter, but that probability goes up to 80 percent…
A: When the occurrence of one event depends on the occurrence of the other event, we use conditional…
Q: Find an 80% confidence interval for the average weights of Allen's hummingbirds in the study region.…
A: It ia given that Sample size n = 15 Sample mean M = 3.15 Population SD = 0.20 The critical value of…
Q: Determine whether the samples are independent or matched pairs. The effectiveness of a headache…
A: Here the variables are X1: intensity of a headache before drug treatment and X2: intensity of a…
Q: A credit crunch gripped the nation in 2007-2008 leading to record numbers of mortgage foreclosures…
A: Matched pairs test We use matched pair test when there are pair of samples are given from same…
Q: Based from the record, the mean weight of the newborn babies is 4.8 lbs with a standard deviation of…
A: Given that Population Mean=4.8 Standard deviation=0.75 Sample size=60
Q: What are the basic guidelines for watching and collecting data on workers?
A: The very first step to collect a data is: Identify issues or opportunities for collecting data: It…
Q: 7. Presidents' Age at Inauguration 65 55 69 61 54 49 46 55 54 55 50 56 56 54 49 58 60 51 43 51 52 68…
A:
Q: Part variability is critical in the manufacturing of ball bearings. Large variances in the size of…
A: The following information has been given: The sample size is n=15 The sample standard deviation is S…
Q: A study conducted in a small company yielded the results shown in the following table Age less than…
A:
Q: 2. Newborn babies are more likely to be boys than girls. A random sample found 13,173 boys were born…
A: SOLUTION :- (2)
Q: Find a 0.90 confidence interval for the mean claim payment. (Round your answers to two decimal…
A: It is given that Sample size n = 360 Sample mean M = 1600 Population SD = 232 The critical values of…
Q: You conduct a survey and receive the following scores from your participants: 7, 4, 1, 2, 5, 4, 5,…
A: As per company guidelines I solved exactly three subparts of the question . thank you
Q: Please help on F, G, and H? What is the relationship between the amount of time statistics…
A: Given data : X Y 7 66 14 82 6 66 4 51 6 61 6 70 11 68 12 77 10 68
Q: At a large industrial plant, employees were classified according to age and given a leadership exam.…
A: Hypothesis test are used to determine whether there is any significancy exist between the sample and…
Q: Identify the type I error and the type Il error that corresponds to the given hypothesis. The…
A: The type I error is defined as rejecting the null hypothesis when it is true. The type II error is…
Q: Find a 61% confidence interval for the true average temperature of the sub's reactor.
A:
Q: The leading brand of powdered milk in the Philippines has a market share of 45%. A sample of 14…
A: Given that n=14 , p=45%=0.45 , q=1-p=1-0.45=0.55 X~Binomial(n=14,p=0.45) X=Number of leading brands…
Q: A research group is studying whether the height of a building affects the ground temperature around…
A: The independent variable is Height. The dependent variable is Temperature. We have to test whether…
Q: Eistics students in Oxnard College sampled 10 textbooks in the Condor bookstore and recorded the…
A: Regression equation Y^= bx +a Where b=slope And a= intercept.
Q: Determine the mean and median. Based on the values of mean and median, what you can expect about…
A: 1.86 1.36 5.12 8.35 14.79 12.61 17.85 10.69 19.98 16.14 13.57 20.05 26.06 20.02 18.13 35.17 33.4…
Q: with a standard deviation of 2.4 years. 3.2 years, alnd he distibdtion is fhon-iormal. A fandom…
A: We have given that Sample mean = 23.2 Standard deviation = 2.4 Sample size = 12
Q: Management proposed the following regression model to predict sales at a fast-food outlet. y Bo+Pz1…
A: For the given equation Find all the required blanks
Q: Lif we are testing for the difference between two population means, it is assumed that the sample…
A: Assumptions of the hypothesis testing 1. Assumptions of homogeneity is that the population…
Q: A student took measurements of the mass of an object using the same balance. The data obtained were…
A: Here Given data of mass of objects using the same balance. Data are 1.383 g, 1,387 g, 1.389 g and…
Q: 1. State A with a population of 256,000 and 10 representatives or state B with a population of…
A: Given that - State A with a population of 256,000 and 10 representatives or state B with a…
Q: Here is a chart of gas mileage (MPG) for various cars. Make and Mode! MPG (highway driving) Honda…
A:
Q: Suppose I wanted to know the proportion of students who are paying attention in class, so I give a…
A: Confidence Interval for Proportion A confidence interval is a statistical method that denotes a…
Q: Coin A has a probability of head equal to 1/4 and probability of tail equa to 3/4 and coin B is a…
A:
Q: TAMU admissions board believes the score you get on the SAT in high school can help predict your…
A:
Q: What is the distribution of XX? XX ~ N(,) What is the distribution of ¯xx¯? ¯xx¯ ~ N(,) What is the…
A: Let X denote the amount of coffee that people drink per day. Given that Mean of X = 17 SD of X = 5…
Q: What is the area under the t-distribution from t=-1.771 tot = 2.160 at df= 13?
A:
Q: Regression. A coach wants to see the relationship between the statistics of practice games and…
A: e) The sample size n is 24.
Q: A study on how the time of exercise affects heart rate had the following output Simple Linear…
A: If I exercise for time=163, what should be my heart rate? After exercising everybody has different…
Q: A grocery store manager did a study to look at the relationship between the am customers spend in…
A: The independent variable is Time. The dependent variable is Money. We have to do correlation and…
Q: What could be the game schedule bracket for the 12 teams of basketball tournament playing from the…
A: First understand bracket A bracket- It contains two football teams, which plays against one another.…
Q: For the following data. X 1.7 3.24 4.8 6.93 y 1.11 1.39 2.73 3.13 a. Find the newton interpolating…
A: Solution: As per the guidelines first three sub parts should be answered.
Please complete solution

Step by step
Solved in 2 steps with 1 images

- Below is a sample of men’s shoe size and height. At 5% level of significance, is there a relationship between men’s shoe size and their height? Shoe size (x) Men's Heights (in inches), y 10 70 10.5 71 9.5 70 11 72 12 74 8.5 66 9 68.5 13 76 10.5 71.5 10.5 70.5 10 72 9.5 70 10 71 10.5 69.5 11 71.5 12 73.5 Leave your answer in 3 decimal places The regression equation: y = + ()xThe following data shows the dexterity test scores of five assembly-line employees of Dimples Company Limited and their respective hourly productivity.Employee Score on dexterity test (?) Ali 12Kofi 14Kwesi 17Abudu 16Nana 11Units produced in an hour (?) 55636770 51You are required to(i) Write the regression equation(ii) Interpret the regression equation(iii) Calculate the Pearson’s Product Moment Correlation Coefficient.(iv) Interpret the correlation coefficient (v) Suppose the dexterity test score is 13, what would be the units produced in an hour? (vi) Clearly explain (in detail) the difference between regression analysis and correlation analysis.Which of the following best describes a regression coefficient in a bivariate setting? a. The change in Y predicted by a unit change in X b. The slope of a line that minimizes the sum of squared residuals c. The correlation coefficient multiplied by SDy/SDx d. All of the above
- The following table displays the mathematics test scores for a random sample ofcollege students, along with their final SY16C grades.a. Fit the regression line y=a+bx to the data and interpret the results.b. Use the regression equation to determine the SY16C grade for a college student whoscored 60 on their achievement test. What would their SY16C gradebe? Mathematics test(x) SY16C grades(y)1 39 652 43 783 21 524 64 825 57 926 47 897 28 738 75…Using the regression line attached. Based on only the above plot, one can conclude: a) height causes an increase in weight b) weight causes an increase in height c) taller people are more likely to weigh more than shorter people, at least in the sample on which this data is based d) a statistically significant predictive relationship between height and weight e) c and dConsider the following data set. x 1 2 3 4 5 y 2.2 2 1.9 1.6 1.1 Find the equation of the regression line. (Round the values to two decimal places.) y =
- Consider the following sample regression equation yˆ = 150 − 20x, where y is the demand for Product A (in 1,000s) and x is the price of the product (in $). The slope coefficient indicates that if _____The following scores represent a nurse’s assessment (X) and a physician’s assessment (Y) of the condition of 10 patients at time of admission to a trauma centre: X: 18 13 18 15 10 12 8 4 7 3 Y: 23 20 18 16 14 11 10 7 6 4 a) Obtain the regression equation. b) What is the predicted physician’s assessment for a nurse’s assessment of; 16 scores? 21 scores? c) Distinguish between extrapolation and interpolationSuppose we run a regression of Y on X using the following data points( xy)in a sample: (0, 1,(1,2).(-10, 9). What is the OLS regression line and what is the RSS? A:1+2X, RSS=3 B:1+X, RSS=0 C:2+X, RSS=-1 D:2+X, RSS=0
- A new computer circuit was tested and the times (in nanoseconds) required to carry out different subroutines were recorded. Difficulty 1 3 3 4 5 6 6 6 Time 10 11 12 9 15 19 21 18 Find the regression line for the data. Assume x is the difficulty level and y is the time. (Round your values to four decimal places.)The following table contains data for the number of bacteria y (in millions) growing in a particular medium after x hours. Using a calculator or statistical software, find the linear regression line for the data in the table. Enter your answer in the form y=mx+b, with m and b both rounded to two decimal places. x y 0 3.67 1 5.24 2 7.04 3 10.31 4 9.83 5 11.04 6 14.68 7 15.02Use the following information to calculate the standard error of the regression that has an intercept (numbers rounded up to two decimal places) Squared sum of the residuals 120 Sample size 80 Number of explanatory variables 5 Total sample variation in explanatory variable 1 60 R-squared of regressing variable 1 on the rest of the variables in the model 0.82 Sample information 0.33 1.20 1.43 0.11