A marketing study of 800 adults in the 18-34 age group reported the following information Question Help v • Spent less than $100 on children's clothing per year 55 responses • Spent $100-$499.99 on children's clothing per year 260 responses • Spent $500-$999 .99 on children's clothing per year 190 responses • Spent nothing the remainder Develop a spreadsheet to estimate the sample mean and sample standard deviation of spending on children's ciothing for this age group using the following formulas, where k is the number of groups and M, is the midpoint of group i A Click the icon to view the formulas Complete the table below (Round to the nearest whole number as needod) Money Spent Midpoint Frequency 1,M, 1 (M, - x)? <100 Question Viewer 100-499.99 500-999.99
A marketing study of 800 adults in the 18-34 age group reported the following information Question Help v • Spent less than $100 on children's clothing per year 55 responses • Spent $100-$499.99 on children's clothing per year 260 responses • Spent $500-$999 .99 on children's clothing per year 190 responses • Spent nothing the remainder Develop a spreadsheet to estimate the sample mean and sample standard deviation of spending on children's ciothing for this age group using the following formulas, where k is the number of groups and M, is the midpoint of group i A Click the icon to view the formulas Complete the table below (Round to the nearest whole number as needod) Money Spent Midpoint Frequency 1,M, 1 (M, - x)? <100 Question Viewer 100-499.99 500-999.99

Glencoe Algebra 1, Student Edition, 9780079039897, 0079039898, 2018
18th Edition
ISBN:9780079039897
Author:Carter
Publisher:Carter
Chapter10: Statistics
Section10.4: Distributions Of Data
Problem 19PFA

Related questions

Concept explainers
Power Operation
Power operation is topic of algebra in Math. It is use to represent repeated multiplication. Very big number and very small number can be easily express using power operation. Power operation is useful in many fields. In space engineering, it helps in representing the distance or size of particular heavenly body. In medical field, it is used to represent very small size. In medical field it helps to mention size of bacteria or virus.
Exponents
The exponent or power or index of a variable/number is the number of times that variable/number is multiplied by itself.
Question
4_10 see picture to solve
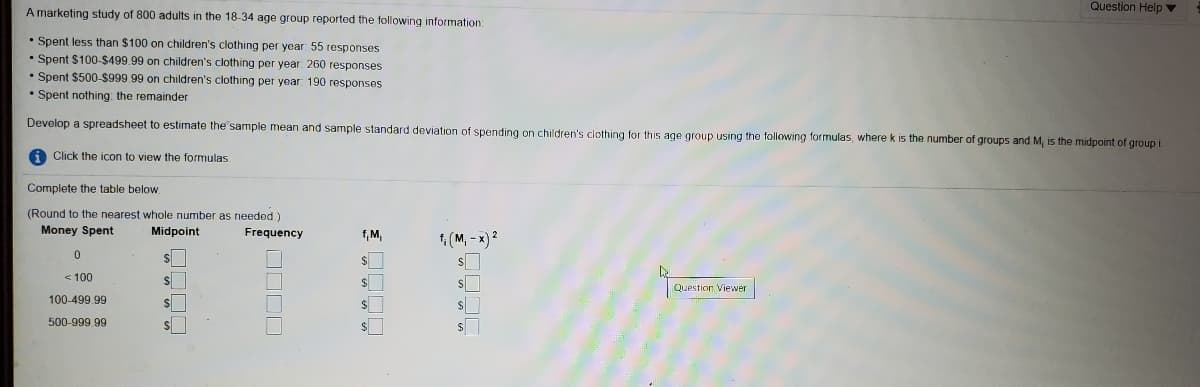
Transcribed Image Text:Question Help v
A marketing study of 800 adults in the 18-34 age group reported the following information
• Spent less than $100 on children's clothing per year 55 responses
• Spent $100-$499.99 on children's clothing per year 260 responses
• Spent $500-$999 99 on children's clothing per year 190 responses
• Spent nothing: the remainder
Develop a spreadsheet to estimate the sample mean and sample standard deviation of spending on children's clothing for this age group using the following formulas, where k is the number of groups and M, is the midpoint of group i.
A Click the icon to view the formulas.
Complete the table below.
(Round to the nearest whole number as needed)
Money Spent
Midpoint
Frequency
f, M
1(M, - x) 2
$
< 100
$
Question Viewer
100-499.99
500-999.99
OODD
Expert Solution
This question has been solved!
Explore an expertly crafted, step-by-step solution for a thorough understanding of key concepts.

This is a popular solution!

Trending now
This is a popular solution!

Step by step
Solved in 2 steps with 2 images

Knowledge Booster


Learn more about
Need a deep-dive on the concept behind this application? Look no further. Learn more about this topic, statistics and related others by exploring similar questions and additional content below.Recommended textbooks for you
Glencoe Algebra 1, Student Edition, 9780079039897…
Algebra
ISBN:
9780079039897
Author:
Carter
Publisher:
McGraw Hill
Glencoe Algebra 1, Student Edition, 9780079039897…
Algebra
ISBN:
9780079039897
Author:
Carter
Publisher:
McGraw Hill