In 1955, Life Magazine reported that a 25-year-old mother of three worked (on average) an 80 hour week. Recently, many groups have been studying whether or not the women's movement has, in fact, resulted in an increase in the average work week women (combining employment and at-home work). Suppose a study was done to determine if the average work week has increased. 77 women were surveyed with the following results. The sample average was 83; the sample standard deviation was 10 Does it appear that the average work week has increased for women at the 5% level? Note: If you are using a Student's t-distribution for the problem, you may assume that the underlying population is normally distributed. (In general, you must first prove that assumption, though.) O Part (a) O Part (b) O Part (c) O Part (d) O Part (e) O Part (f) O Part (g) O Part (h) O Part (i) Construct a 95% confidence interval for the true mean. Sketch the graph of the situation. Label the point estimate and the lower and upper bounds of the confidence interval. (Round your lower and upper bounds to two decimal places.) 95% C.I.
In 1955, Life Magazine reported that a 25-year-old mother of three worked (on average) an 80 hour week. Recently, many groups have been studying whether or not the women's movement has, in fact, resulted in an increase in the average work week women (combining employment and at-home work). Suppose a study was done to determine if the average work week has increased. 77 women were surveyed with the following results. The sample average was 83; the sample standard deviation was 10 Does it appear that the average work week has increased for women at the 5% level? Note: If you are using a Student's t-distribution for the problem, you may assume that the underlying population is normally distributed. (In general, you must first prove that assumption, though.) O Part (a) O Part (b) O Part (c) O Part (d) O Part (e) O Part (f) O Part (g) O Part (h) O Part (i) Construct a 95% confidence interval for the true mean. Sketch the graph of the situation. Label the point estimate and the lower and upper bounds of the confidence interval. (Round your lower and upper bounds to two decimal places.) 95% C.I.

Glencoe Algebra 1, Student Edition, 9780079039897, 0079039898, 2018
18th Edition
ISBN:9780079039897
Author:Carter
Publisher:Carter
Chapter10: Statistics
Section10.6: Summarizing Categorical Data
Problem 10CYU

Related questions

Question
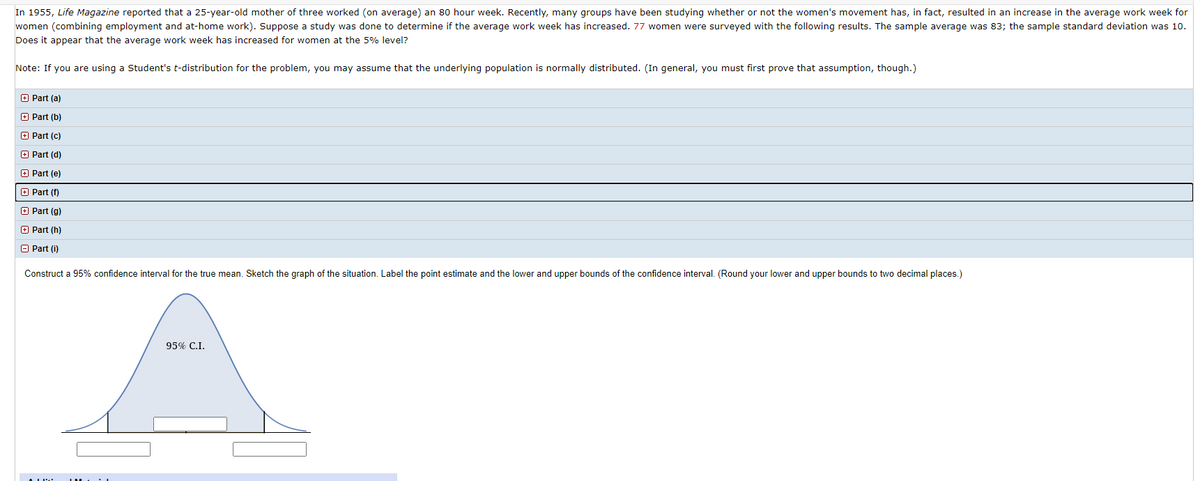
Transcribed Image Text:In 1955, Life Magazine reported that a 25-year-old mother of three worked (on average) an 80 hour week. Recently, many groups have been studying whether or not the women's movement has, in fact, resulted in an increase in the average work week for
women (combining employment and at-home work). Suppose a study was done to determine if the average work week has increased. 77 women were surveyed with the following results. The sample average was 83; the sample standard deviation was 10.
Does it appear that the average work week has increased for women at the 5% level?
Note: If you are using a Student's t-distribution for the problem, you may assume that the underlying population is normally distributed. (In general, you must first prove that assumption, though.)
+ Part (a)
O Part (b)
O Part (c)
O Part (d)
O Part (e)
+ Part (f)
O Part (g)
O Part (h)
O Part (i)
Construct a 95% confidence interval for the true mean. Sketch the graph of the situation. Label the point estimate and the lower and upper bounds of the confidence interval. (Round your lower and upper bounds to two decimal places.)
95% C.I.
Expert Solution
This question has been solved!
Explore an expertly crafted, step-by-step solution for a thorough understanding of key concepts.

This is a popular solution!

Trending now
This is a popular solution!

Step by step
Solved in 3 steps with 2 images

Knowledge Booster


Learn more about
Need a deep-dive on the concept behind this application? Look no further. Learn more about this topic, statistics and related others by exploring similar questions and additional content below.Recommended textbooks for you
Glencoe Algebra 1, Student Edition, 9780079039897…
Algebra
ISBN:
9780079039897
Author:
Carter
Publisher:
McGraw Hill

Holt Mcdougal Larson Pre-algebra: Student Edition…
Algebra
ISBN:
9780547587776
Author:
HOLT MCDOUGAL
Publisher:
HOLT MCDOUGAL

College Algebra (MindTap Course List)
Algebra
ISBN:
9781305652231
Author:
R. David Gustafson, Jeff Hughes
Publisher:
Cengage Learning
Glencoe Algebra 1, Student Edition, 9780079039897…
Algebra
ISBN:
9780079039897
Author:
Carter
Publisher:
McGraw Hill
Holt Mcdougal Larson Pre-algebra: Student Edition…
Algebra
ISBN:
9780547587776
Author:
HOLT MCDOUGAL
Publisher:
HOLT MCDOUGAL
College Algebra (MindTap Course List)
Algebra
ISBN:
9781305652231
Author:
R. David Gustafson, Jeff Hughes
Publisher:
Cengage Learning