A master marksman hires an accomplished craftsman to design recurve bows fo is latest line of archery branding weapons. The craftsman proposes five unique ow designs to the marksman who tests them out with expert archers to check the naximum bow range per design. The following data shows the distance in yards p rcher using any one of the five designs: Design Design Design Design Design
Q: The scores of the top ten finishers in a recent race are listed below. 65 66 66 67 67 67 68 70 70 71…
A:
Q: The table displays data on use of Facebook by two groups of Penn State University students. It is…
A: please see below
Q: The mode for the data: 22,17,18,25,22,52,27,33 is equal to (2 Points) O 18 17 O 22 O 27
A: We have to find mode of the data .....
Q: A group of students were surveyed about the number of hours they spent studying in the last week.…
A: Consider the given table of data. We have to draw a dotplot that represents the responses gives in…
Q: Use MINITAB or some other computer software toconstruct a stem-and-leaf display for the following…
A: The stem and leaf plot is obtained using EXCEL MegaStat. The software procedure is given below:…
Q: Data was collected for 40 randomly selected trees growing in the median strip of a busy freeway. The…
A: Answer : The horizontal axis of the histogram denotes the height.
Q: Compute the coefficient of variation of each data. Which of the two twine types is more uniform in…
A: Mean: For a set of n observations, x1, x2, ... , xn, mean is given by, Standard deviation: For a…
Q: A textile worker in the city of Bombay earns 350 per month. The cost of living for a particular…
A:
Q: The boxplot shown below results from the heights (cm) of males listed ih a data set. What do the…
A: From the given boxplot we have to identify minimum value , Q1 , Q2 , Q3 , maximum value.
Q: The dola below represent the number of laptops. lisled. Sad By a lool Computer slore for the Years…
A: The time series is used to display the value of a variable with respect to time. It is generated by…
Q: The following models have the indicated AIC values. Which is the best model based on this metric?…
A:
Q: In a certain period of time, the order of the AveCcavage enters the order of 50 and 40 instruments;…
A:
Q: i ile a in - filunir, mpwy leie ey Vhat s the mcec or the data? Need Help? Paad
A:
Q: Determine whether the data set represents a direct variatión, ail y 420 х 2 3 280 4. 210 Direct…
A: Answer: G. Inverse variation.
Q: Determine the values of the three principal components for the following observation.
A: principle components is the new variable which is linear combination of initial variable . In the…
Q: Average cheques received per day for KH Connect and WebLink by municipality, 2017 & 2018 Average…
A:
Q: To help consumers in purchasing a laptop computer, Consumer Reports calculates an overall test score…
A: In this problem we have observations on two variables price and score of laptop or computers. We are…
Q: a researcher wants to determine how employee salaries at a certain company are related to the length…
A: Given:
Q: Determine the measure of ZRQS in the diagram below.
A: Consider the given diagram: Sum of angles formed by a ray on a line is 180°.
Q: (a) Develop a scatter diagram with price as the independent variable. A scatter diagram has 9 points…
A: (A) Scatter Plot for the Data and price as the independent variable. Price ($) Overall Score…
Q: Find the range for the set of data given. 21) 111 484 170 617 360 290 A) 484 B) 111 C) 120 D) 506
A: The given data is, 111, 484, 170, 617, 360, 290.
Q: Use the data in the following table, which lists drive-thru order accuracy at popular fast food…
A: As per our guidelines, we are allowed to answer first three-sub parts only. thanks Given :
Q: Each subject in a study has two lines of data. Line 1 contains an ID, GENDER (M or F), and DOB; line…
A: Given information: The data represents the values of the variables ID, GENDER, DOB, HEIGHT and…
Q: The following travel times were measured for vehicles as they traveled a 15-mile segment of highway.…
A:
Q: A master marksman hires an accomplished craftsman to design recurve bows for his latest line of…
A: Given: The data is shown below Design 1 Design 2 DESIGN 3 Design 4 Design 5 38 50 26 29 45…
Q: "Brand of soft drink" is measured on a(n)
A: Brand is a tag or label that a soft drink has. A nominal scale is a type of measurement scale in…
Q: Find a natural cubic spline interpolating the data (-1, 13), (0,7), (1,9)
A: Writing data in table format x -1 0 1 y 13 7 9 Formula for natural cubic spline is:…
Q: Use natural cubic splines interpolation with the data given below, to calculate the fuel economy at…
A:
Q: Refer to the table summarizing service times (seconds) of dinners at a fast food restaurant. How…
A: The total number of individuals is the sum of all frequencies. The number of individuals included in…
Q: A master marksman hires an accomplished craftsman to design recurve bows for his latest line of…
A: Mean square of the error (MSE) is calculated by dividing the sum of squares of the residual…
Q: Below are the clocked driving speeds (in miles per hour) a police officer recorded for drivers along…
A: Five Number Summary : A five-number summary simply consists of the smallest data value, the first…
Q: The accompanying table contains the number of partners in a cohort of rising accounting firms that…
A: The five number summary is minimum, first quartile, median, third quartile and maximum values of the…
Q: The following data give the speeds (in miles per hour) of eight cars that were stopped om I-95 for…
A:
Q: A scatter plot is graphed on the coordinate grid shown below. 10 3 1 0 1234 5 6 7 8 9 10 987 O54
A:
Q: Data was collected for 300 fish from the North Atlantic. The length of the fish (in mm) is…
A: Here Frequency distribution table is in class limit form. We need to convert Class limit to class…
Q: Determine whether the given value is a statistic or a parameter. A health and fitness club surveys…
A: We have to determine the given value is a statistic or a parameter. A health and fitness club…
Q: Solve with cubic spline method which interpolate the following dataset of (x,y) points: (97,16),…
A: To solve with cubic spline method which interpolate the following data set of (x,y) points: (97,16),…
Q: The lengths and weights of a zoo's pygmy shrews were recorded during their annual health check.…
A:
Q: Which of the following data would best be represented by a pie chart? The number of students who…
A: The percentage of QCC students in each major (that helps to form a over all cumulative percentage)…
Q: A consumer buying cooperative tested the effective heating area of 20 different electric space…
A: Simple linear regression model: A simple linear regression model is given as y^ = b0 + bx + e…
Q: how to solve
A: Range:The range is the difference between the largest and smallest observations in a set of data.…
Q: The following data give the total rebounds per game (2) and points per game (y) professional…
A: Given data, X Y X*Y X*X Y*Y 9 8 72 81 64 7 9 63 49 81 4 7 28 16 49 3 2 6 9 4 6 9 54 36…
Q: FIll in the cells of a copy of the following table so that the two variables are Independent. Do the…
A: Solution: The given data is
Q: During which month were there 150 tornadoes? Tornadoes per Month in Oklahoma 175 %23 150 125 100 75…
A:
Q: A poll reported that 62% of adults were satisfied with the job the major airlines were doing.…
A: Givenp=0.62n=20Let "x"be no.of the adults satisfied with the…
Q: Determine which scatterplot shows the strongest linear correlatioI O A. OB.
A: We have to find best option.
Q: A researcher gathers data from a sample that consists of five scores of 5, 7, 2, 7 and 9. a. Find…
A: a) From the data to calculate mean and standard deviation μ= Σxin = 305=6σ= Σ(xi-x¯)2n = 285 =…
Q: Assume the height of students are normally distributed, do boys and girls differ in height in one…
A:
Q: A landscape contractor bids on jobs where he can make $3000 profit. The relative ncy of getting 1,…
A: Given information: Given that the landscape contractor bids on jobs where he can make a profit of…
Hi! I need your help. Thank you so much!
Using the 0.05 level of significance, calculate the P-value.
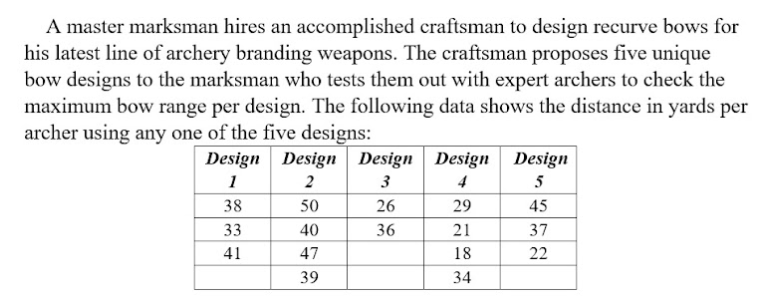
Step by step
Solved in 2 steps with 1 images
- To help consumers in purchasing a laptop computer, Consumer Reports calculates an overall test score for each computer tested based upon rating factors such as ergonomics, portability, performance, display, and battery life. Higher overall scores indicate better test results. The following data show the average retail price and the overall score for ten 13-inch models.† Brand & Model Price ($) OverallScore Samsung Ultrabook NP900X3C-A01US 1,250 83 Apple MacBook Air MC965LL/A 1,300 83 Apple MacBook Air MD231LL/A 1,200 82 HP ENVY 13-2050nr Spectre XT 950 79 Sony VAIO SVS13112FXB 800 77 Acer Aspire S5-391-9880 Ultrabook 1,200 74 Apple MacBook Pro MD101LL/A 1,200 74 Apple MacBook Pro MD313LL/A 1,000 73 Dell Inspiron I13Z-6591SLV 700 67 Samsung NP535U3C-A01US 600 63 #1) Use the least squares method to develop the estimated regression equation. (Round your numerical values to three decimal places). ŷ = #2) Suppose the price for another laptop that…To help consumers in purchasing a laptop computer, Consumer Reports calculates an overall test score for each computer tested based upon rating factors such as ergonomics, portability, performance, display, and battery life. Higher overall scores indicate better test results. The following data show the average retail price and the overall score for ten 13-inch models.† Brand & Model Price ($) OverallScore Samsung Ultrabook NP900X3C-A01US 1,250 83 Apple MacBook Air MC965LL/A 1,300 83 Apple MacBook Air MD231LL/A 1,200 82 HP ENVY 13-2050nr Spectre XT 950 79 Sony VAIO SVS13112FXB 800 77 Acer Aspire S5-391-9880 Ultrabook 1,200 74 Apple MacBook Pro MD101LL/A 1,200 74 Apple MacBook Pro MD313LL/A 1,000 73 Dell Inspiron I13Z-6591SLV 700 67 Samsung NP535U3C-A01US 600 63 (a) Develop a scatter diagram with price as the independent variable.To help consumers in purchasing a laptop computer, Consumer Reports calculates an overall test score for each computer tested based upon rating factors such as ergonomics, portability, performance, display, and battery life. Higher overall scores indicate better test results. The following data show the average retail price and the overall score for ten 13-inch models.† Brand & Model Price ($) OverallScore Samsung Ultrabook NP900X3C-A01US 1,250 83 Apple MacBook Air MC965LL/A 1,300 83 Apple MacBook Air MD231LL/A 1,200 82 HP ENVY 13-2050nr Spectre XT 950 79 Sony VAIO SVS13112FXB 800 77 Acer Aspire S5-391-9880 Ultrabook 1,200 74 Apple MacBook Pro MD101LL/A 1,200 74 Apple MacBook Pro MD313LL/A 1,000 73 Dell Inspiron I13Z-6591SLV 700 67 Samsung NP535U3C-A01US 600 63 Use the least squares method to develop the estimated regression equation. (Round your numerical values to three decimal places).
- In 1998, as an advertising campaign, the Nabisco Company announced a "1000 Chips Challenge," claiming that every 18-ounce bag of their Chips Ahoy cookies contained at least 1000 chocolate chips. Dedicated statistics students at the Air Force Academy (no kidding) purchased some randomly selected bags of cookies and counted the chocolate chips. Some of their data are given below.1219 1214 1087 1200 1419 1121 1325 1345 1244 1258 1356 1132 1191 1270 1295 1135Find a 95% confidence interval for the mean number of chips in a bag of Chips Ahoy Cookies.Is the number of games won by a major league baseball team in a season related to the team batting average? The table below shows the number of games won and the batting average (in thousandths) of 8 teams. Team Games Won Batting Average 1 6060 259259 2 120120 277277 3 8989 263263 4 101101 288288 5 8585 287287 6 109109 270270 7 7777 272272 8 106106 290290 Using games won as the explanatory variable xx, do the following: (a) The correlation coefficient is r=r= . (b) The equation of the least squares line is y^=y^= . SpeakAn advertising company is comparing published listening figures for differentradio stations and podcasts in order to decide where is the best place to puttheir adverts. The audience figures for the last 20 quarters of radio stationsA and B are in Table 1.Table 1 Audience figures in 100 000’s of radio stations A and B for the last20 quartersRadio Station A Radio Station B109 95103 98105 97110 96108 97106 96105 97109 95112 93112 94115 95111 91113 92112 96115 102105 103109 100107 106105 108108 104page 3 of 9(a) (i) Find the summary values for radio stations A and B, usingDataplotter or otherwise. Copy and complete the table below.Round values, where necessary, to one decimal place. The mean,rounded to one decimal place, is given for you as a check that youhave entered the data correctly. [1]Table 2 Summary values of audience figures in 100 000’s for radiostations A and B.Radio Station A Radio Station BMinMedianMaxMean 109.0 97.8SDIQRRange(ii) Use the two measures of location to say which…
- Is the number of games won by a major league baseball team in a season related to the team batting average? The table below shows the number of games won and the batting average (in thousandths) of 8 teams. Team Games Won Batting Average 1 8383 289289 2 116116 290290 3 101101 287287 4 8181 262262 5 110110 288288 6 119119 269269 7 6060 268268 8 6161 280280 Using games won as the explanatory variable xx, do the following: (a) The correlation coefficient is r=r= . (b) The equation of the least squares line is y^=y^=To compare textbook prices at the two most popular online booksellers, a Statistics student gathered information about 14 college textbooks from Amazon.com and bn.com on November 25, 2006. For each book, she recorded the name of the principal author, the title, the ISBN, the Amazon selling price (in dollars) and the B&N selling price (in dollars): author title ISBN Amazon B&N De Veaux Intro Stats 321286715 120.67 103.20 Christensen Introduction to Statistics 155459651 164.95 155.95 Thomas Calculus 321185587 154.67 152.00 Stewart Calculus 534393217 153.98 155.75 Simmons Calculus with Analytic Geometry 70576424 150.00 159.75 Alexander American Public School Law 534274242 128.95 115.85 Miller Business Law Today 324204841 108.95 103.95 Cheeseman Business Law 131984934 166.67 159.60 Berg Biochemistry 716787245 149.95 148.91 Raymond General Organic and Biological Chemistry 471447072 95.95 98.95 Atkins Chemical Principles 071675701X 141.95 139.75 Warren…The manager of a fleet of automobiles is testing two brands of radial tires. He assigns one tire of each brand at random to the two rear wheels of eight cars and runs the cars until the tires wear out. The data (in kilometers) are shown below: Car Brand 1 Brand 2 1 34900 36700 2 45500 47200 3 37100 37700 4 32000 31400 5 48900 47800 6 32800 36900 7 38500 38900 8 30100 31800 Find a 95% confidence interval on the difference in mean mileage. Assume that the differences of the distances are approximately normally distributed.
- A random sample of 20 deaths in the US due to carbon monoxide (CO) poisoning from generators for a particular year was taken and the region (urban core, sub-urban, large rural, small rural/isolated) in which the death occurred was recorded. The recorded data are in the table below. Urban Urban Urban SubUrb SubUrb SubUrb LargeR SmallR SmallR SubUrb LargeR SmallR Urban LargeR LargeR SubUrb Urban SubUrb Urban Urban (a) What is the population? deaths in the US due to carbon monoxide (CO) poisoning deaths in the US due to carbon monoxide (CO) poisoning from generators for a particular year 20 randomly selected deaths in the US due to carbon monoxide (CO) poisoning 20 randomly selected deaths in the US due to carbon monoxide (CO) poisoning from generators for a particular year a randomly selected death a randomly selected death in the US due to carbon monoxide (CO) poisoning from generators for a particular year Region Urban (b) What is the sample? deaths in the US…Over a nine-month period, OutdoorgearLab tested hardshell jackets designed for iceclimbing, mountaineering, and backpacking. Based on the breathability, durability, versatility, features, mobility, and weight of each jacket, an overall rating ranging from 0(lowest) to 100 (highest) was assigned to each jacket tested. The following data show theresults for 20 top-of-the-line jackets (OutdoorgearLab website, February 27, 2013).42 66 67 71 78 62 61 76 71 6761 64 61 54 83 63 68 69 81 53a. Compute the mean, median, and mode.b. Compute the first and third quartiles.c. Compute and interpret the 90th percentile.Over a nine-month period, OutdoorgearLab tested hardshell jackets designed for iceclimbing, mountaineering, and backpacking. Based on the breathability, durability, versatility, features, mobility, and weight of each jacket, an overall rating ranging from 0(lowest) to 100 (highest) was assigned to each jacket tested. The following data show theresults for 20 top-of-the-line jackets (OutdoorgearLab website, February 27, 2013).42 66 67 71 78 62 61 76 71 6761 64 61 54 83 63 68 69 81 53a. Compute the mean, median, and mode