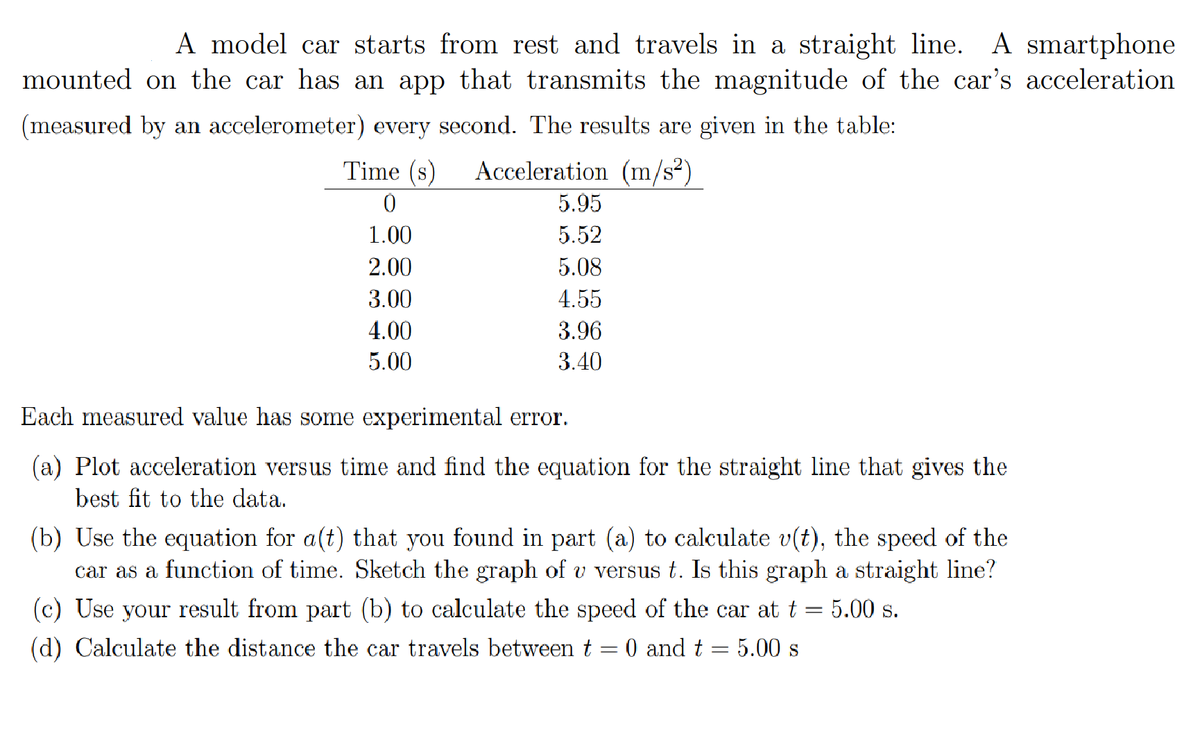
A model car starts from rest and travels in a straight line. A smartphone mounted on the car has an app that transmits the magnitude of the car's acceleration (measured by an accelerometer) every second. The results are given in the table: Time (s) Acceleration (m/s²) 5.95 1.00 5.52 2.00 5.08 3.00 4.55 4.00 3.96 5.00 3.40 Each measured value has some experimental error. (a) Plot acceleration versus time and find the equation for the straight line that gives the best fit to the data. (b) Use the equation for a(t) that you found in part (a) to calculate v(t), the speed of the car as a function of time. Sketch the graph of v versus t. Is this graph a straight line? (c) Use your result from part (b) to calculate the speed of the car at t = 5.00 s. (d) Calculate the distance the car travels between t = 0 and t = 5.00 s
A model car starts from rest and travels in a straight line. A smartphone mounted on the car has an app that transmits the magnitude of the car's acceleration (measured by an accelerometer) every second. The results are given in the table: Time (s) Acceleration (m/s²) 5.95 1.00 5.52 2.00 5.08 3.00 4.55 4.00 3.96 5.00 3.40 Each measured value has some experimental error. (a) Plot acceleration versus time and find the equation for the straight line that gives the best fit to the data. (b) Use the equation for a(t) that you found in part (a) to calculate v(t), the speed of the car as a function of time. Sketch the graph of v versus t. Is this graph a straight line? (c) Use your result from part (b) to calculate the speed of the car at t = 5.00 s. (d) Calculate the distance the car travels between t = 0 and t = 5.00 s
Principles of Physics: A Calculus-Based Text
5th Edition
ISBN:9781133104261
Author:Raymond A. Serway, John W. Jewett
Publisher:Raymond A. Serway, John W. Jewett
Chapter2: Motion In One Dimension
Section: Chapter Questions
Problem 1OQ: One drop of oil falls straight down onto the road from the engine of a moving car every 5 s. Figure...
Related questions
Question

Transcribed Image Text:A model car starts from rest and travels in a straight line. A smartphone
mounted on the car has an app that transmits the magnitude of the car's acceleration
(measured by an accelerometer) every second. The results are given in the table:
Time (s)
Acceleration (m/s²)
5.95
1.00
5.52
2.00
5.08
3.00
4.55
4.00
3.96
5.00
3.40
Each measured value has some experimental error.
(a) Plot acceleration versus time and find the equation for the straight line that gives the
best fit to the data.
(b) Use the equation for a(t) that you found in part (a) to calculate v(t), the speed of the
car as a function of time. Sketch the graph of v versus t. Is this graph a straight line?
(c) Use your result from part (b) to calculate the speed of the car at t = 5.00 s.
(d) Calculate the distance the car travels between t = 0 and t = 5.00 s
Expert Solution
This question has been solved!
Explore an expertly crafted, step-by-step solution for a thorough understanding of key concepts.
This is a popular solution!
Trending now
This is a popular solution!
Step by step
Solved in 7 steps with 2 images

Knowledge Booster
Learn more about
Need a deep-dive on the concept behind this application? Look no further. Learn more about this topic, physics and related others by exploring similar questions and additional content below.Recommended textbooks for you

Principles of Physics: A Calculus-Based Text
Physics
ISBN:
9781133104261
Author:
Raymond A. Serway, John W. Jewett
Publisher:
Cengage Learning

Principles of Physics: A Calculus-Based Text
Physics
ISBN:
9781133104261
Author:
Raymond A. Serway, John W. Jewett
Publisher:
Cengage Learning