A Mouse brain kDa Control Atg7 CKO 250- 50- 50- 50- 37- E MEF with starvation Atg7 WT Atg7 KO kDa 0 3 6 9 0 3 6 9h 250- 50- 50- 15- 37- F Relative protein level +AKAP11 + Rla 1.5* Rila 1.0 0.5- 0.0+ 0 3 6 Atg7 WT -AKAP11 -Rila -Rla -p62 -Actin gh Relative protein level 1.5 1.0 0.5- B Control Atg7 CKO 8₁ 0.0 Relative Protein level -AKAP11 -Rila -Rla -LC31 -LC311 -Actin + ल 2 AKAP11 +AKAP11 +Rla Rila J Ria ns Rila с kDa 250- 50- 50- 50- 37- G 50- 50- HEK293T with starvation Atg7 WT Atg7 KO kDa 0 3 6 9 0 3 6 9h 250- 15- 37- H Relative protein level Mouse brain Control Atg14 CKO 1.0 +Rla 1.5 Rila 0.5- +AKAP11 0.0+ # # 6 9h -AKAP11 -Rila -Ria -p62 -Actin 3 Atg7 WT Relative protein level 1.0 Relative Protein level 0.5- 8- 0.0+ 9.00 99 -AKAP11 -Rila -Ria LLC31 FLC311 -Actin 2 1.5 Rila *² Control Atg14 CKO AKAP11 AKAP11 - Rla J Rla 3 6 gh Atg7 KO Fig. 1. AKAP11 and Rla are degraded by autophagy. (A) Brain lysates of Atg7FF (Control) and Atg7fF-SynCre (CKO) were subjected to immunoblotting analysis with the indicated antibodies. (B) Quantification of protein levels in A. Unpaired Student's t tests were used, and values are presented as mean + SEM (n = 3 mice/genotype). **P < 0.01; ***P < 0.001; ns, not significant. (C) Brain lysates of Atg14F (Control) and Atg14FF-SynCre (cKO) were subjected to immunoblotting analysis with the indicated antibodies. (D) Quantification of protein levels in C. Unpaired Student's t tests were used, and values are pre- sented as mean ± SEM (n = 4 mice/genotype). **P<0.01; ***P<0.001; ns, not significant. (E) Atg7 WT and Atg7 KO MEF cells were nutrient starved by using EBSS for the indicated times, and cells were assayed by immunoblotting analysis with the indicated antibodies. (F) Quantification of the protein levels from E was obtained by normalizing the level of proteins to Actin, respectively, and further to the respective control. One-way ANOVA was used in each genotype, and values are presented as mean ± SEM (n = 3). *P<0.05; **P<0.01. (G) Atg7 WT and Atg7 KO HEK293T cells were nutrient starved by using EBSS for the indicated times and were then assayed by immunoblotting analysis with the indicated antibodies. (H) Quantification of the protein levels from G was obtained by normalizing the level of proteins to Actin, respectively, and further to the respective control. One-way ANOVA was used in each genotype, and values are presented as mean ± SEM (n = 4). "P<0.05; **P < 0.01; ***P < 0.001. 3 6 9h Atg7 KO ns Rila CELL BIOLOGY

Biology 2e
2nd Edition
ISBN:9781947172517
Author:Matthew Douglas, Jung Choi, Mary Ann Clark
Publisher:Matthew Douglas, Jung Choi, Mary Ann Clark
Chapter9: Cell Communication
Section: Chapter Questions
Problem 12RQ: Histamine binds to the H1 G-protein-linked receptor to initiate the itchiness and airway...
icon
Related questions
Question

Autophagy Is Required for PKA Activation and Cell Viability upon Glucose
Starvation. The functional relationship between PKA and autophagy
is largely unclear. Because PKA controls cell metabolism particularly related to glucose status (21–23), we first examined the relationship between autophagy and PKA activity in the control of cell
metabolism with glucose limitation. We found that in addition to
activating autophagy, glucose starvation also induced the phosphorylation of cAMP response element-binding (p-CREB), a wellknown PKA substrate, indicative of elevated PKA activity in both
HEK293T and HCT116 cells. In contrast, disruption of autophagy
by deletion of essential autophagy gene Atg7 or Atg14 abolished the
increase of p-CREB levels in the above cells (SI Appendix, Fig.
S1 A, B, D, and E), suggesting that inactivation of autophagy suppresses PKA activity in response to energy shortage. Moreover, loss
of Atg7 or Atg14 accelerated cell death in response to glucose
starvation (SI Appendix, Fig. S1 C and F). Taken together, our results show that autophagy is required for PKA activation and important for cell viability under metabolic stress.


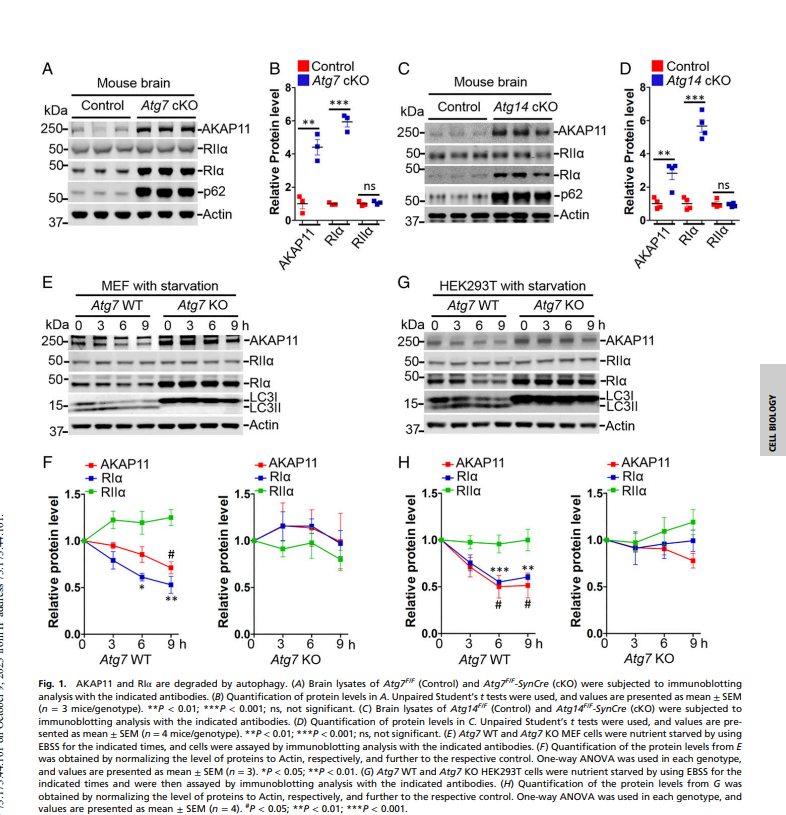
Fig. 1. AKAP11 and RIα are degraded by autophagy. (A) Brain lysates of Atg7F/F (Control) and Atg7F/F-SynCre (cKO) were subjected to immunoblotting analysis with the indicated antibodies. (B) Quantification of protein levels in A. Unpaired Student's t tests were used, and values are presented as mean ± SEM (n = 3 mice/genotype). **P < 0.01; ***P < 0.001; ns, not significant. (C) Brain lysates of Atg14F/F (Control) and Atg14F/F-SynCre (cKO) were subjected to immunoblotting analysis with the indicated antibodies. (D) Quantification of protein levels in C. Unpaired Student's t tests were used, and values are presented as mean ± SEM (n = 4 mice/genotype). **P < 0.01; ***P < 0.001; ns, not significant. (E) Atg7 WT and Atg7 KO MEF cells were nutrient starved by using EBSS for the indicated times, and cells were assayed by immunoblotting analysis with the indicated antibodies. (F) Quantification of the protein levels from E was obtained by normalizing the level of proteins to Actin, respectively, and further to the respective control. One-way ANOVA was used in each genotype, and values are presented as mean ± SEM (n = 3). *P < 0.05; **P < 0.01. (G) Atg7 WT and Atg7 KO HEK293T cells were nutrient starved by using EBSS for the indicated times and were then assayed by immunoblotting analysis with the indicated antibodies. (H) Quantification of the protein levels from G was obtained by normalizing the level of proteins to Actin, respectively, and further to the respective control. One-way ANOVA was used in each genotype, and values are presented as mean ± SEM (n = 4). # P < 0.05; **P < 0.01; ***P < 0.001.


can you please explain figure A-H I dont understand what it represents 
A
Mouse brain
kDa Control Atg7 CKO
250-
50-
50-
50-
37-
E
MEF with starvation
Atg7 WT
Atg7 KO
kDa 0 3 6 9 0 3 6 9h
250-
50-
50-
15-
37-
F
Relative protein level
+AKAP11
+ Rla
1.5* Rila
1.0
0.5-
0.0+
0
3 6
Atg7 WT
-AKAP11
-Rila
-Rla
-p62
-Actin
gh
Relative protein level
1.5
1.0
0.5-
B Control
Atg7 CKO
8₁
0.0
Relative Protein level
-AKAP11
-Rila
-Rla
-LC31
-LC311
-Actin
+
ल
2
AKAP11
+AKAP11
+Rla
Rila
J
Ria
ns
Rila
с
kDa
250-
50-
50-
50-
37-
G
50-
50-
HEK293T with starvation
Atg7 WT Atg7 KO
kDa 0 3 6 9 0 3 6 9h
250-
15-
37-
H
Relative protein level
Mouse brain
Control Atg14 CKO
1.0
+Rla
1.5 Rila
0.5-
+AKAP11
0.0+
#
#
6 9h
-AKAP11
-Rila
-Ria
-p62
-Actin
3
Atg7 WT
Relative protein level
1.0
Relative Protein level
0.5-
8-
0.0+
9.00
99
-AKAP11
-Rila
-Ria
LLC31
FLC311
-Actin
2
1.5 Rila
*²
Control
Atg14 CKO
AKAP11
AKAP11
- Rla
J
Rla
3 6 gh
Atg7 KO
Fig. 1. AKAP11 and Rla are degraded by autophagy. (A) Brain lysates of Atg7FF (Control) and Atg7fF-SynCre (CKO) were subjected to immunoblotting
analysis with the indicated antibodies. (B) Quantification of protein levels in A. Unpaired Student's t tests were used, and values are presented as mean + SEM
(n = 3 mice/genotype). **P < 0.01; ***P < 0.001; ns, not significant. (C) Brain lysates of Atg14F (Control) and Atg14FF-SynCre (cKO) were subjected to
immunoblotting analysis with the indicated antibodies. (D) Quantification of protein levels in C. Unpaired Student's t tests were used, and values are pre-
sented as mean ± SEM (n = 4 mice/genotype). **P<0.01; ***P<0.001; ns, not significant. (E) Atg7 WT and Atg7 KO MEF cells were nutrient starved by using
EBSS for the indicated times, and cells were assayed by immunoblotting analysis with the indicated antibodies. (F) Quantification of the protein levels from E
was obtained by normalizing the level of proteins to Actin, respectively, and further to the respective control. One-way ANOVA was used in each genotype,
and values are presented as mean ± SEM (n = 3). *P<0.05; **P<0.01. (G) Atg7 WT and Atg7 KO HEK293T cells were nutrient starved by using EBSS for the
indicated times and were then assayed by immunoblotting analysis with the indicated antibodies. (H) Quantification of the protein levels from G was
obtained by normalizing the level of proteins to Actin, respectively, and further to the respective control. One-way ANOVA was used in each genotype, and
values are presented as mean ± SEM (n = 4). "P<0.05; **P < 0.01; ***P < 0.001.
3 6 9h
Atg7 KO
ns
Rila
CELL BIOLOGY
Transcribed Image Text:A Mouse brain kDa Control Atg7 CKO 250- 50- 50- 50- 37- E MEF with starvation Atg7 WT Atg7 KO kDa 0 3 6 9 0 3 6 9h 250- 50- 50- 15- 37- F Relative protein level +AKAP11 + Rla 1.5* Rila 1.0 0.5- 0.0+ 0 3 6 Atg7 WT -AKAP11 -Rila -Rla -p62 -Actin gh Relative protein level 1.5 1.0 0.5- B Control Atg7 CKO 8₁ 0.0 Relative Protein level -AKAP11 -Rila -Rla -LC31 -LC311 -Actin + ल 2 AKAP11 +AKAP11 +Rla Rila J Ria ns Rila с kDa 250- 50- 50- 50- 37- G 50- 50- HEK293T with starvation Atg7 WT Atg7 KO kDa 0 3 6 9 0 3 6 9h 250- 15- 37- H Relative protein level Mouse brain Control Atg14 CKO 1.0 +Rla 1.5 Rila 0.5- +AKAP11 0.0+ # # 6 9h -AKAP11 -Rila -Ria -p62 -Actin 3 Atg7 WT Relative protein level 1.0 Relative Protein level 0.5- 8- 0.0+ 9.00 99 -AKAP11 -Rila -Ria LLC31 FLC311 -Actin 2 1.5 Rila *² Control Atg14 CKO AKAP11 AKAP11 - Rla J Rla 3 6 gh Atg7 KO Fig. 1. AKAP11 and Rla are degraded by autophagy. (A) Brain lysates of Atg7FF (Control) and Atg7fF-SynCre (CKO) were subjected to immunoblotting analysis with the indicated antibodies. (B) Quantification of protein levels in A. Unpaired Student's t tests were used, and values are presented as mean + SEM (n = 3 mice/genotype). **P < 0.01; ***P < 0.001; ns, not significant. (C) Brain lysates of Atg14F (Control) and Atg14FF-SynCre (cKO) were subjected to immunoblotting analysis with the indicated antibodies. (D) Quantification of protein levels in C. Unpaired Student's t tests were used, and values are pre- sented as mean ± SEM (n = 4 mice/genotype). **P<0.01; ***P<0.001; ns, not significant. (E) Atg7 WT and Atg7 KO MEF cells were nutrient starved by using EBSS for the indicated times, and cells were assayed by immunoblotting analysis with the indicated antibodies. (F) Quantification of the protein levels from E was obtained by normalizing the level of proteins to Actin, respectively, and further to the respective control. One-way ANOVA was used in each genotype, and values are presented as mean ± SEM (n = 3). *P<0.05; **P<0.01. (G) Atg7 WT and Atg7 KO HEK293T cells were nutrient starved by using EBSS for the indicated times and were then assayed by immunoblotting analysis with the indicated antibodies. (H) Quantification of the protein levels from G was obtained by normalizing the level of proteins to Actin, respectively, and further to the respective control. One-way ANOVA was used in each genotype, and values are presented as mean ± SEM (n = 4). "P<0.05; **P < 0.01; ***P < 0.001. 3 6 9h Atg7 KO ns Rila CELL BIOLOGY
Expert Solution
steps

Step by step

Solved in 1 steps

Blurred answer
Similar questions
  • SEE MORE QUESTIONS
Recommended textbooks for you
Biology 2e
Biology 2e
Biology
ISBN:
9781947172517
Author:
Matthew Douglas, Jung Choi, Mary Ann Clark
Publisher:
OpenStax
Biology: The Unity and Diversity of Life (MindTap…
Biology
ISBN:
9781337408332
Author:
Cecie Starr, Ralph Taggart, Christine Evers, Lisa Starr
Publisher:
Cengage Learning
Biology: The Unity and Diversity of Life (MindTap…
Biology
ISBN:
9781305073951
Author:
Cecie Starr, Ralph Taggart, Christine Evers, Lisa Starr
Publisher:
Cengage Learning