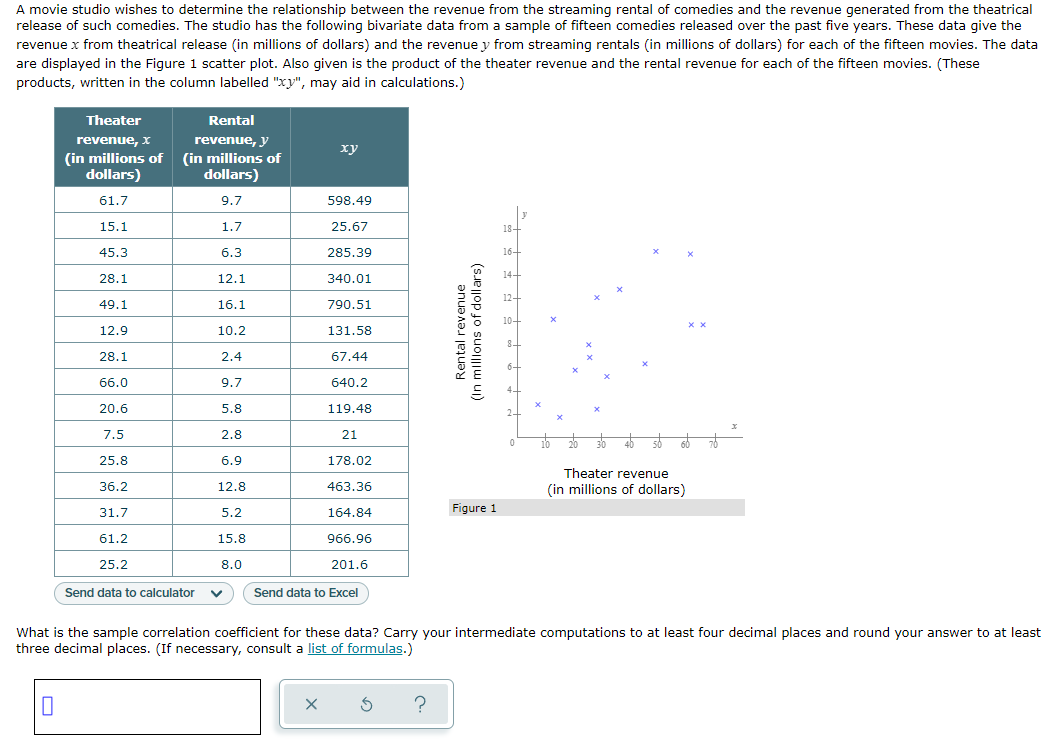
A movie studio wishes to determine the relationship between the revenue from the streaming rental of comedies and the revenue generated from the theatrical release of such comedies. The studio has the following bivariate data from a sample of fifteen comedies released over the past five years. These data give the revenue x from theatrical release (in millions of dollars) and the revenue y from streaming rentals (in millions of dollars) for each of the fifteen movies. The data are displayed in the Figure 1 scatter plot. Also given is the product of the theater revenue and the rental revenue for each of the fifteen movies. (These products, written in the column labelled "xy", may aid in calculations.) Theater Rental revenue, y revenue, x xy (in millions of (in millions of dollars) dollars) 61.7 9.7 598.49 15.1 1.7 25.67 18 45.3 6.3 285.39 16+ 14- 28.1 12.1 340.01 12+ 49.1 16.1 790.51 xx 12.9 10.2 131.58 28.1 2.4 67.44 66.0 9.7 640.2 20.6 5.8 119.48 7.5 2.8 21 25.8 6.9 178.02 Theater revenue 36.2 12.8 463.36 (in millions of dollars) 31.7 5.2 164.84 Figure 1 61.2 15.8 966.96 25.2 8.0 201.6 Send data to calculator V Send data to Excel What is the sample correlation coefficient for these data? Carry your intermediate computations to at least four decimal places and round your answer to at least three decimal places. (If necessary, consult a list of formulas.) 0 X S ? Rental revenue (In millions of dollars)
A movie studio wishes to determine the relationship between the revenue from the streaming rental of comedies and the revenue generated from the theatrical release of such comedies. The studio has the following bivariate data from a sample of fifteen comedies released over the past five years. These data give the revenue x from theatrical release (in millions of dollars) and the revenue y from streaming rentals (in millions of dollars) for each of the fifteen movies. The data are displayed in the Figure 1 scatter plot. Also given is the product of the theater revenue and the rental revenue for each of the fifteen movies. (These products, written in the column labelled "xy", may aid in calculations.) Theater Rental revenue, y revenue, x xy (in millions of (in millions of dollars) dollars) 61.7 9.7 598.49 15.1 1.7 25.67 18 45.3 6.3 285.39 16+ 14- 28.1 12.1 340.01 12+ 49.1 16.1 790.51 xx 12.9 10.2 131.58 28.1 2.4 67.44 66.0 9.7 640.2 20.6 5.8 119.48 7.5 2.8 21 25.8 6.9 178.02 Theater revenue 36.2 12.8 463.36 (in millions of dollars) 31.7 5.2 164.84 Figure 1 61.2 15.8 966.96 25.2 8.0 201.6 Send data to calculator V Send data to Excel What is the sample correlation coefficient for these data? Carry your intermediate computations to at least four decimal places and round your answer to at least three decimal places. (If necessary, consult a list of formulas.) 0 X S ? Rental revenue (In millions of dollars)

Linear Algebra: A Modern Introduction
4th Edition
ISBN:9781285463247
Author:David Poole
Publisher:David Poole
Chapter7: Distance And Approximation
Section7.3: Least Squares Approximation
Problem 31EQ

Related questions
Question
Transcribed Image Text:A movie studio wishes to determine the relationship between the revenue from the streaming rental of comedies and the revenue generated from the theatrical
release of such comedies. The studio has the following bivariate data from a sample of fifteen comedies released over the past five years. These data give the
revenue x from theatrical release (in millions of dollars) and the revenue y from streaming rentals (in millions of dollars) for each of the fifteen movies. The data
are displayed in the Figure 1 scatter plot. Also given is the product of the theater revenue and the rental revenue for each of the fifteen movies. (These
products, written in the column labelled "xy", may aid in calculations.)
Theater
Rental
revenue, y
revenue, x
xy
(in millions of (in millions of
dollars)
dollars)
61.7
9.7
598.49
15.1
1.7
25.67
45.3
6.3
285.39
28.1
12.1
340.01
49.1
16.1
790.51
xx
12.9
10.2
131.58
28.1
2.4
67.44
66.0
9.7
640.2
20.6
5.8
119.48
7.5
2.8
21
25.8
6.9
178.02
Theater revenue
36.2
12.8
463.36
(in millions of dollars)
31.7
5.2
164.84
Figure 1
61.2
15.8
966.96
25.2
8.0
201.6
Send data to calculator
Send data to Excel
What is the sample correlation coefficient for these data? Carry your intermediate computations to at least four decimal places and round your answer to at least
three decimal places. (If necessary, consult a list of formulas.)
0
X
S
?
Rental revenue
(In millions of dollars)
*********.
12+
0
X
x
Expert Solution
This question has been solved!
Explore an expertly crafted, step-by-step solution for a thorough understanding of key concepts.

This is a popular solution!

Trending now
This is a popular solution!

Step by step
Solved in 3 steps with 3 images

Recommended textbooks for you
Linear Algebra: A Modern Introduction
Algebra
ISBN:
9781285463247
Author:
David Poole
Publisher:
Cengage Learning

Glencoe Algebra 1, Student Edition, 9780079039897…
Algebra
ISBN:
9780079039897
Author:
Carter
Publisher:
McGraw Hill

Functions and Change: A Modeling Approach to Coll…
Algebra
ISBN:
9781337111348
Author:
Bruce Crauder, Benny Evans, Alan Noell
Publisher:
Cengage Learning
Linear Algebra: A Modern Introduction
Algebra
ISBN:
9781285463247
Author:
David Poole
Publisher:
Cengage Learning
Glencoe Algebra 1, Student Edition, 9780079039897…
Algebra
ISBN:
9780079039897
Author:
Carter
Publisher:
McGraw Hill
Functions and Change: A Modeling Approach to Coll…
Algebra
ISBN:
9781337111348
Author:
Bruce Crauder, Benny Evans, Alan Noell
Publisher:
Cengage Learning