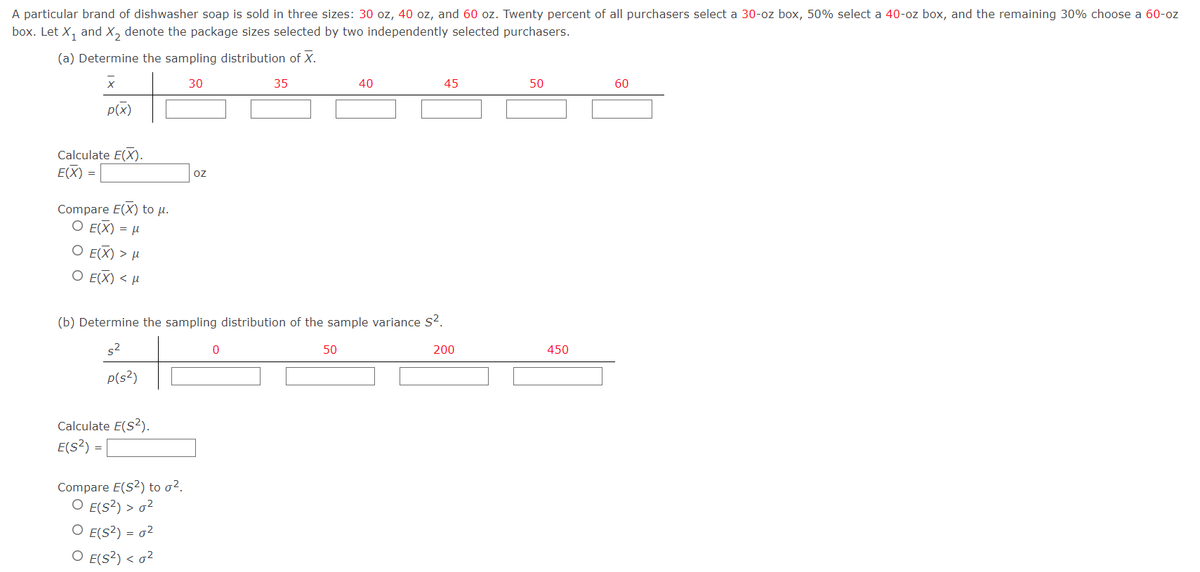
A particular brand of dishwasher soap is sold in three sizes: 30 oz, 40 oz, and 60 oz. Twenty percent of all purchasers select a 30-oz box, 50% select a 40-oz box, and the remaining 30% choose a 60-oz box. Let X₁ and X₂ denote the package sizes selected by two independently selected purchasers. (a) Determine the sampling distribution of X. X 30 35 40 45 50 60 P(x) Calculate E(X). E(X) = Compare E(X) to μ. O E(X) = μ O E(X) > H Ο Ε(Χ) < με (b) Determine the sampling distribution of the sample variance S². 0 50 200 s² p(s²) Calculate E(S²). E(S²) = Compare E(S2) to σ². O E(S²) > 0² O E(S²) = 0² O E(S²) < 0² oz 450


Q: es. u go to the cafeteria for lunch and have a choice of 4 entrees, 5 sides, 5 drinks, and 4 =serts.…
A: Given choice of 4 entrees, 5 sides, 5 drinks, 4 desserts.
Q: What are the two main branches of statistics? The two main branches of statistics are qualitative…
A:
Q: The following equation describes the median housing price in a community in terms of amount of…
A: The given model is : log(price)=β0+β1log(nox)+β2rooms+μ where nox is for nitrous oxide rooms…
Q: (F). (Round to three decimal places as Evaluate the formula E=z, # where z = 1.960, o= 32.43, and n…
A:
Q: INSTRUCTION: Solve for the following. Show your complete solution and emphasize your final answers.…
A:
Q: Use this table or the ALEKS calculator to complete the following. Give your answers to four decimal…
A: Given problem Given that a) The area under the standard normal curve to the right of z=2.67 is,…
Q: Find μ if μ => [x - P(x)]. Then, find o if o² = [x² - P(x)]-μ². Cl X 0 1 2 3 4 5 P(x) 0.0001 0.0028…
A: Given that X 0 1 2 3 4 5 P(x) 0.0001 0.0028 0.0289 0.1517 0.3983 0.4182
Q: Many students take standardized tests for college applications. They are called standardized tests…
A: Given, Suppose the mean and standard deviation for the ACT composite score, the SAT critical reading…
Q: Each sweat shop worker at a computer factory can put together 4.9 computers per hour on average with…
A:
Q: A sample of 200 college freshmen was asked how many hours per week they spent playing video games.…
A: The question is about frequency distribution Given :
Q: Pearson correlation is an example of a nonlinear correlation true or false
A: We have given that, Pearson correlation is an example of a nonlinear correlation true or false?
Q: Below are pilot data from a phase one randomized clinical trial where patients with schizophrenia…
A: The question is about ANOVA Given :
Q: 0.68 (d) 25th (e) 10th
A: Given that. X~N( 0 , 1 ) μ=0 , ?=1 (for standard normal distribution)
Q: ces S in Tools A census collected data on everyone that lived who has four children. Its probability…
A: Given that Probability distribution. X 0 1 2 3 4 P(X=x) 0.0857 0.2447 0.3208 0.2415 0.1073
Q: A sample of 200 college freshmen was asked how many hours per week they spent playing video games.…
A: ( a ) How many classes are there? ( b ) What is the class width?
Q: Pay your bills: In a large sample of customer accounts, a utility company determined that the…
A:
Q: ACTIVITY Problem Solving. Read and analyze the given problem then answer the following questions.…
A: Given that Sample size n =30 Population mean μ =80 Population standard deviation =5 Sample mean =77…
Q: Below is a graph of a normal distribution with mean μ=-1 and standard deviation G=4. The shaded…
A: GivenMean(μ)=-1standard deviation(σ)=4
Q: Q1\A/ Consider a discrete random variable X whose pmf is given by: Find: 1-E[ X ] and Var( X )? f(x)…
A: Given p.m.f. is f(x)=13 x=-1,0,1 =0 otherwise
Q: 1. The diameter of a ball bearing was measured by 12 inspectors, each using two different kinds of…
A: 1) The objective is to test if there is a significant difference between the means of the population…
Q: At a local college, 76 of the male students are smokers and 114 are non-smokers. Of the female…
A:
Q: Shown below are the scatter plots for four different data sets. Answer the questions that follow.…
A: From the given scatterplots, it is observed that figure1 shows the negative linear relationship.…
Q: (h) P(1.26 ≤ Z ≤ 2.50) (1) P(1.90 ≤ Z) (1) P(|Z| ≤ 2.50)
A: It is given that the standard normal random variable Z with mean 0 and variance 1. Note: The…
Q: The class width is
A: here given minimum = 7 maximum = 70 number of classes = 6
Q: The mean incubation time of fertilized eggs is 19 days. Suppose the incubation times are…
A: Suppose the incubation times are approximately normally distributed with a standard deviation of 1…
Q: Engineers must consider the breadths of male heads when designing helmets. The company researchers…
A:
Q: Classify the variable as discrete or continuous. "Weights of the backp school bus." Select one: O a.…
A: We know that Discrete variable: The variable which gives the countable and finite values.…
Q: Graphs, tables, or photographs are the best ways to present. Select one: O a. The introduction O b.…
A: Answer:- Graph, tables or photographs the best way to present.
Q: (g) P(-1.10 SZ ≤ 2.00) (h) P(1.06 ≤ Z ≤ 2.50) (1) P(1.10 ≤ Z)
A: The mean and standard deviation of the standard normal distribution are 0 and 1 respectively.
Q: The weight of a small Starbucks coffee is a normally distributed random variable with a mean of 420…
A:
Q: population of parameter A. 1. Find a 90% confidence interval for X;
A:
Q: The relationship between nominal exchange rate and relative prices. From annual observations from…
A: Given, The relationship between nominal exchange rate and relative prices. From annual observations…
Q: Let - 3.71 <μ< -0.15 represent an interval on the number line. Find the value that is in the middle…
A: Given -3.71< mu < -0.15
Q: Consider a random sample of 20 observations. The sample variance is 30.5. Construct a 95%…
A: Givensample size(n)=20sample variance(s2)=30.5confidence interval=95%
Q: Consider the following regression output: Ît = 0.2033 +0.656Xt se (0.0976) (0.1961) r² = 0.397…
A:
Q: who has four children. Its probability distribution is shown below. Complete parts a through c. 0 1…
A: Given that Probability distribution. X 0 1 2 3 4 P(X=x) 0.0857 0.2447 0.3208 0.2415 0.1073
Q: Below is a graph of a normal distribution with mean μ=-2 and standard deviation G=3. The shaded…
A: GivenMean(μ)=-2standard devaition(σ)=3
Q: You wish to test the following claim (a) at a significance level of α = 0.05. Ho: μ = 59.1 Ha:μ >…
A: It is given that Population mean, μ = 59.1 Sample mean, M = 62.7 Standard deviation, s = 18.8…
Q: Calculate the age standardized IHD mortality rate using the Standard population. Show all…
A: Given:The data is given and find the Age standardized IHD mortality rate (ASMR).
Q: 18, 12, 14, 15, 13, 14, 12, 17, 16, 15 solve for median
A:
Q: (d) {between two and five lines, inclusive, are in use} (e) {between two and four lines, inclusive,…
A: For the given data Find all the required probabilities ( d ) {between two ad five lines, inclusive,…
Q: Given are five observations for two variables, and y a. Which of the following scatter diagrams…
A: Given data values for observations x and y. We have to fit the regression equation of y on x and…
Q: (2) If we are interested in determining if the proportions of smokers in the three categories are…
A: Claim : the proportions of smokers in the three categories are equal.
Q: Obtaining significant interactions guarantees that ALL of the main effects will statistically…
A: Given, Obtaining significant interactions guarantees that ALL of the main effects will statistically…
Q: Classifying Events. Consider the events: A ball numbered 1 through 40 Is selected from a bit and…
A: Given Classifying Events. Consider the events: A ball numbered 1 through 40 Is selected from a bit…
Q: Identify the sampling techniques used, and discuss potential sources of bias (if any). Explain.…
A: Solution: Stratified random sampling: Stratified random sampling is a type of probability or random…
Q: Determine the confidence interval of the following: Given the information: the sampled population…
A:
Q: Example 4-4. A factory produces a certain type of outputs by three types of machine. The respective…
A: The following information has been given: The daily output of Machine I =3000 units The daily output…
Q: From the past observations, the standard deviation of a bus to travel from one bus stop to the next…
A: Estimation of sample size is critical to hypothesis testing.
Q: school children in their district and find an average one-way commute time of 38 minutes with a…
A:
q5


Trending now
This is a popular solution!

Step by step
Solved in 2 steps with 2 images

- A potato chip company produces a large number of potato chip bags each day and wants to investigate whether a new packaging machine will lower the proportion of bags that are damaged. The company selected a random sample of 150 bags from the old machine and found that 15 percent of the bags were damaged, then selected a random sample of 200 bags from the new machine and found that 8 percent were damaged. Let pˆOp^O represent the sample proportion of bags packaged on the old machine that are damaged, pˆNp^N represent the sample proportion of bags packaged on the new machine that are damaged, pˆCp^C represent the combined proportion of damaged bags from both machines, and nOnO and nNnN represent the respective sample sizes for the old machine and new machine. Have the conditions for statistical inference for testing a difference in population proportions been met? No, the condition for independence has not been met, because random samples were not selected. A No, the…Let p1 and p2 be the respective proportions of women with iron-deficiency anemia in each of two developing countries. A random sample of 1900 women from the first country yielded 513 women with iron-deficiency anemia, and an independently chosen, random sample of 1700 women from the second country yielded 515 women with iron-deficiency anemia. Can we conclude, at the 0.10 level of significance, that the proportion of women with anemia in the first country is less than the proportion of women with anemia in the second country? Perform a one-tailed test. Then complete the parts below.Carry your intermediate computations to three or more decimal places and round your answers as specified in the parts below. a. State the null hypothesis H0 and the alternative hypothesis H1. b. Find the values of the test statistic. c. FInd the p-value. d. Can we conclude that the proportion of women with anemia in the first country is less than the proportion of women with anemia in the second country?Two investigators have studied the income of a group of persons by the method of sam-pling. The following table gives their findings Investigator Poor Middle Class Well-to-do TotalA 160 30 10 200B 140 120 40 300Total 300 150 50 500 Using Chi-squared test, show that the sampling technique of at least one of the investi-gators is a suspect at 5% level of significance.
- A particular brand of dishwasher soap is sold in three sizes: 25 oz, 35 oz, and 60 oz. Twenty percent of all purchasers select a 25-oz box, 50% select a 35-oz box, and the remaining 30% choose a 60-oz box. Let X1 and X2 denote the package sizes selected by two independently selected purchasers. (a) Determine the sampling distribution of X. x 25 30 35 42.5 47.5 60 p(x) Calculate E(X). E(X) = ozCompare E(X) to ?. E(X) > ? E(X) < ? E(X) = ? (b) Determine the sampling distribution of the sample variance S2. s2 0 50 312.5 612.5 p(s2) Calculate E(S2).E(S2) = Compare E(S2) to ?2. E(S2) = ?2 E(S2) > ?2 E(S2) < ?2A domestic manufacturer of watches purchases quartz crystals from a Swiss firm. Thecrystals are shipped in lots of 1000. The acceptance sampling procedure uses 20 randomlyselected crystals.a. Construct operating characteristic curves for acceptance numbers of 0, 1, and 2.b. If p0 is .01 and p1 = .08, what are the producer’s and consumer’s risks for each sampling plan in part (a)?In analyzing the consumption of cottage cheese by members of various occupational groups, the United Dairy Industry Association found that 326 of 837 professionals seldom or never ate cottage cheese, versus 220 of 489 white-collar workers and 522 of 1243 blue-collar workers (Sheet 53). Assuming independent samples, use the 0.03 level in testing the null hypothesis that the population proportions could be the same for the three occupational groups. Sheet 53 Group 1 Group 2 Group 3 Total seldom or never 326 220 522 1068 often 511 269 721 1501 Total 837 489 1243 2569 Select one: a) chi-square stat = 4.81, crit. value = 7.01, fail to reject H0, population proportions are not different b) p-value = 0.09, reject H0, population proportions are not different c) chi-square stat = 4.81, crit. value = 9.2, fail to reject H0, population proportions are not different d) p-value = 0.029, reject H0, population proportions different
- 1) A cement producer, manufactures and then fills 40kg-bags of powder cement on twodistinct production tracks located in separate suburbs. To determine whether differencesexist between the average fill rates for the two tracks, a random sample of 25 bags fromTrack 1 and a random sample of 16 bags from Track 2 were recently selected. Each bag’sweight was measured and the following information measures from the samples arereported:Production ProductionTrack 1 Track 2n1 = 25 n2 = 16x2 = 40.02 x1 = 39.87 s1 = 0.59 s2 = 0.88 Supervision believes that the fill rates of the two tracks are normally distributed with equalvariances.Construct a 95% confidence interval estimate of the true mean difference between the twotracks.--------------------------------------------------------------------------------------------------------------2) Two independent simple random samples were selected from two normallydistributed populations with unequal variances yielded the following information:Sample 1…An experiment in teaching research methods in psychology was recently conducted at a large university. One section was taught by the traditional lecture-lab method, a second was taught by an all-lab/demonstration approach with no lectures, and a third was taught entirely by a series of videotaped lectures and demonstrations that the students were free to view at any time and as often as they wished. Students were randomly assigned to each of the three sections, and, at the end of the semester, random samples of final exam scores were collected from each section. Test whether teaching method affected student performance on the final exam. Use the .05 significance level. What is the null hypothesis? Lecture/Lab All-Lab/Demo Videotaped M1=70.67 M2=72.33 M3=65.33 S1=2.95 S2=3.29 S3=1.20 N1=5 N2=5 N3=5 Group of answer choices The mean final exam score for Videotaped is lower than the mean final exam scores for Lecture/Lab and All-Lab/Demo The mean final exam score for…An experiment in teaching research methods in psychology was recently conducted at a large university. One section was taught by the traditional lecture-lab method, a second was taught by an all-lab/demonstration approach with no lectures, and a third was taught entirely by a series of videotaped lectures and demonstrations that the students were free to view at any time and as often as they wished. Students were randomly assigned to each of the three sections, and, at the end of the semester, random samples of final exam scores were collected from each section. Test whether teaching method affected student performance on the final exam. Use the .05 significance level. What is the correct decision and conclusion? Lecture/Lab All-Lab/Demo Videotaped M1=70.67 M2=72.33 M3=65.33 S1=2.95 S2=3.29 S3=1.20 N1=5 N2=5 N3=5 Group of answer choices Decision: Do not reject the null hypothesis; Conclusion: The mean final exam scores for the three teaching methods are different…
- An experiment in teaching research methods in psychology was recently conducted at a large university. One section was taught by the traditional lecture-lab method, a second was taught by an all-lab/demonstration approach with no lectures, and a third was taught entirely by a series of videotaped lectures and demonstrations that the students were free to view at any time and as often as they wished. Students were randomly assigned to each of the three sections, and, at the end of the semester, random samples of final exam scores were collected from each section. Test whether teaching method affected student performance on the final exam. Use the .05 significance level. What cutoff score(s) should be used? Lecture/Lab All-Lab/Demo Videotaped M1=70.67 M2=72.33 M3=65.33 S1=2.95 S2=3.29 S3=1.20 N1=5 N2=5 N3=5 Group of answer choices +3.68 +3.89 +3.74 +3.81 PreviousNextIn a breeding experiment, chicken with white feathers, small comb were mated and the offspring categories white feathers, small comb (WS), white feathers. large comb (WL), dark feathers, small comb (DS) and dark feathers, large comb (DL) were expected to follow the ratio 9:3:3:1 the researcher observed that there were 100 WS, 32 WL, 40 DS and 20 DL offspring. In order to test if the observed frequencies follow the expected ratio, what should be the hull hypothesis?A. P(WS) = 100/192, P(WL) = 32/192, P(DS) = 40/192 , P(DL) = 20/192 B. P(WS) = 100 , P(WL) = 32, P(DS) = 40, P(DL) = 20 C. P(WS) = 9/16 , P(WL) = 3/16, P(DS) = 3/16, P(DL) = 1/16 D. P(WS) = 9, P(WL) = 3, P(DS) = 3 , P(DL) = 1 2. In Problem 1, what would be the degree of freedom for an appropriate test?A.2 B.3 C.4 D.1 3. What is the value of the computed test statistic in problem 1? A.7.81 B.3.84 C.6.81 D.5.99 5.What would be the p-value for this test in problem 1? A.0.28 B.0.05 C.0.08 D. 0.11 6. At 5-% level of significance,…In a population where 67%67% of voters prefer Candidate A, how many voters must be sampled for the distribution of voters that prefer candidate A to be normally distributed? In a population where 46%46% of voters prefer Candidate A, how many voters must be sampled for the distribution of voters that prefer candidate A to be normally distributed?