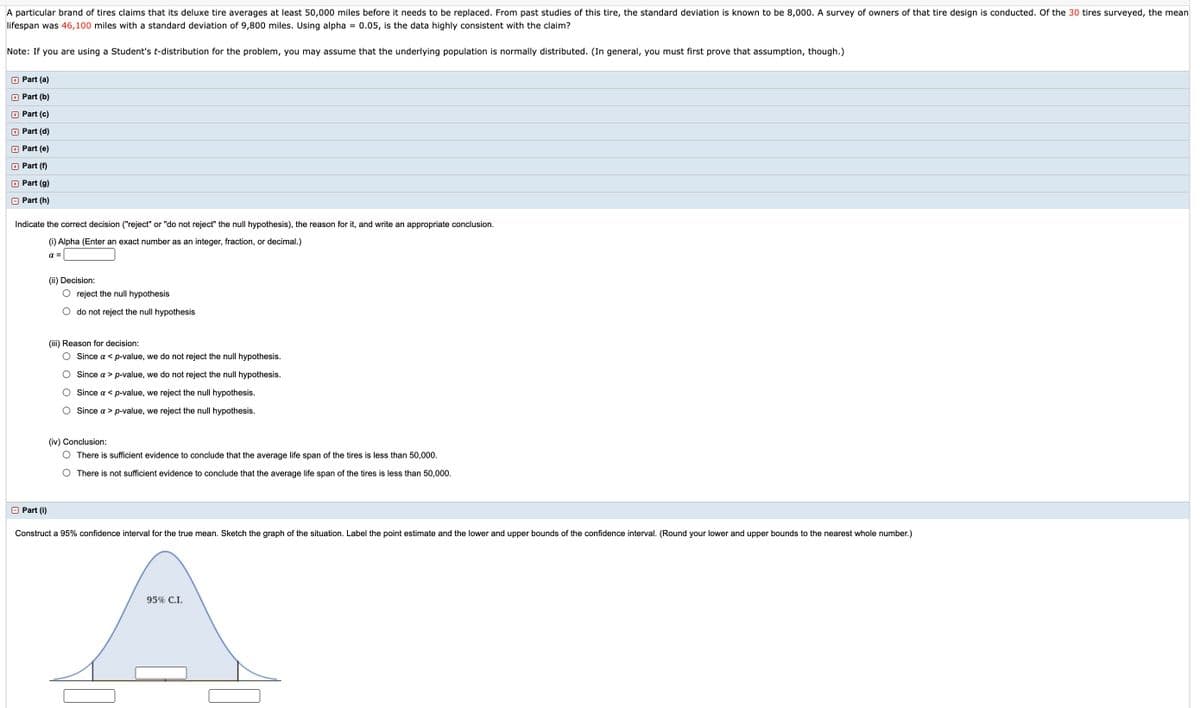
A particular brand of tires claims that its deluxe tire averages at least 50,000 miles before it needs to be replaced. From past studies of this tire, the standard deviation is known to be 8,000. A survey of owners of that tire design is conducted. Of the 30 tires surveyed, the mea lifespan was 46,100 miles with a standard deviation of 9,800 miles. Using alpha = 0.05, is the data highly consistent with the claim? Note: If you are using a Student's t-distribution for the problem, you may assume that the underlying population is normally distributed. (In general, you must first prove that assumption, though.) O Part (a) O Part (b) O Part (c) O Part (d) O Part (e) O Part (n O Part (g) O Part (h) Indicate the correct decision ("reject" or "do not rejecr the null hypothesis), the reason for it, and write an appropriate conclusion. ) Alpha (Enter an exact number as an integer, fraction, or decimal.) (i) Decision: O reject the nul hypothesis O do not reject the null hypothesis (i) Reason for decision: O since a p-value, we do not reject the null hypothesis O Since a > p-value, we do not reject the null hypothesis. O Since a < p-value, we reject the null hypothesis. O Since a> p-value, we reject the null hypothesis. (iv) Conclusion: O There is sufficient evidence to conclude that the average life span of the tires is less than 50.000. O There is not sufficient evidence to conclude that the average life span of the tires is less than 50,000.


Quadratic Equation
When it comes to the concept of polynomial equations, quadratic equations can be said to be a special case. What does solving a quadratic equation mean? We will understand the quadratics and their types once we are familiar with the polynomial equations and their types.
Demand and Supply Function
The concept of demand and supply is important for various factors. One of them is studying and evaluating the condition of an economy within a given period of time. The analysis or evaluation of the demand side factors are important for the suppliers to understand the consumer behavior. The evaluation of supply side factors is important for the consumers in order to understand that what kind of combination of goods or what kind of goods and services he or she should consume in order to maximize his utility and minimize the cost. Therefore, in microeconomics both of these concepts are extremely important in order to have an idea that what exactly is going on in the economy.
Can someone please explain the steps to solve this? I would appreciate it greatly


Trending now
This is a popular solution!

Step by step
Solved in 2 steps with 2 images


