A particular professor has noticed that the number of people, P, who complain about his attitude is dependent on the number of cups of coffee, n, he drinks. From eight days of tracking he compiled the following data: People (P) Cups of coffee (n) 10 1 11 1 10 2
A particular professor has noticed that the number of people, P, who complain about his attitude is dependent on the number of cups of coffee, n, he drinks. From eight days of tracking he compiled the following data: People (P) Cups of coffee (n) 10 1 11 1 10 2

Functions and Change: A Modeling Approach to College Algebra (MindTap Course List)
6th Edition
ISBN:9781337111348
Author:Bruce Crauder, Benny Evans, Alan Noell
Publisher:Bruce Crauder, Benny Evans, Alan Noell
Chapter5: A Survey Of Other Common Functions
Section5.6: Higher-degree Polynomials And Rational Functions
Problem 1TU: The following fictitious table shows kryptonite price, in dollar per gram, t years after 2006. t=...

Related questions

Question
R1
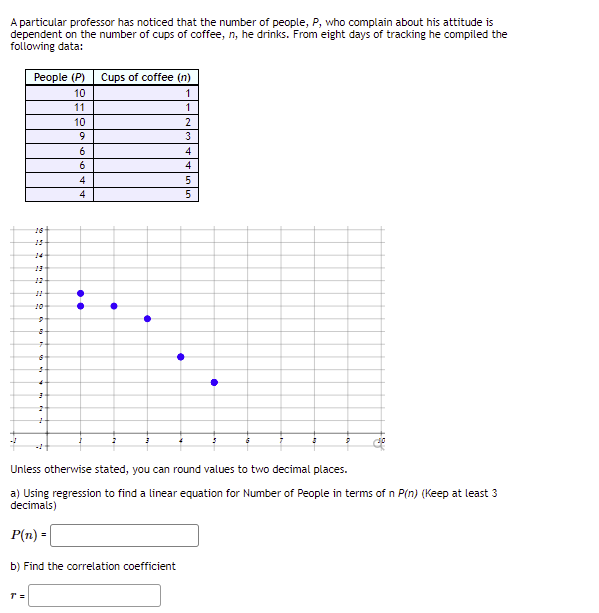
Transcribed Image Text:A particular professor has noticed that the number of people, P, who complain about his attitude is
dependent on the number of cups of coffee, n, he drinks. From eight days of tracking he compiled the
following data:
Реople (P)
Cups of coffee (n)
10
1
11
1
10
2
9
3
6
4
4
4
5
4
5
16
14
13
12
10
Unless otherwise stated, you can round values to two decimal places.
a) Using regression to find a linear equation for Number of People in terms of n P(n) (Keep at least 3
decimals)
P(n) =
b) Find the correlation coefficient
T =
..
Expert Solution
This question has been solved!
Explore an expertly crafted, step-by-step solution for a thorough understanding of key concepts.

This is a popular solution!

Trending now
This is a popular solution!

Step by step
Solved in 2 steps with 1 images

Knowledge Booster


Learn more about
Need a deep-dive on the concept behind this application? Look no further. Learn more about this topic, statistics and related others by exploring similar questions and additional content below.Recommended textbooks for you
Functions and Change: A Modeling Approach to Coll…
Algebra
ISBN:
9781337111348
Author:
Bruce Crauder, Benny Evans, Alan Noell
Publisher:
Cengage Learning

Algebra & Trigonometry with Analytic Geometry
Algebra
ISBN:
9781133382119
Author:
Swokowski
Publisher:
Cengage

College Algebra
Algebra
ISBN:
9781305115545
Author:
James Stewart, Lothar Redlin, Saleem Watson
Publisher:
Cengage Learning
Functions and Change: A Modeling Approach to Coll…
Algebra
ISBN:
9781337111348
Author:
Bruce Crauder, Benny Evans, Alan Noell
Publisher:
Cengage Learning
Algebra & Trigonometry with Analytic Geometry
Algebra
ISBN:
9781133382119
Author:
Swokowski
Publisher:
Cengage
College Algebra
Algebra
ISBN:
9781305115545
Author:
James Stewart, Lothar Redlin, Saleem Watson
Publisher:
Cengage Learning

Algebra and Trigonometry (MindTap Course List)
Algebra
ISBN:
9781305071742
Author:
James Stewart, Lothar Redlin, Saleem Watson
Publisher:
Cengage Learning