A pension fund manager is considering three mutual funds. The first is a stock fund, the second is a long-term bond fund, and the third is a money market fund that provides a safe return of 5.5%. The characteristics of the risky funds are as follows: Expected Return Standard Deviation Stock fund (S) 15% 32% Bond fund (B) 9 23 The correlation between the fund returns is .15 11.) Suppose now that your portfolio must yield an expected return of 12% and be efficient that is, on the best feasible CAL. a.) What is the standard deviation of your portfolio? b.) What are the proportion invested in the T-bill fund and each of the two risky funds?
A pension fund manager is considering three mutual funds. The first is a stock fund, the second is a long-term bond fund, and the third is a money market fund that provides a safe return of 5.5%. The characteristics of the risky funds are as follows: Expected Return Standard Deviation Stock fund (S) 15% 32% Bond fund (B) 9 23 The correlation between the fund returns is .15 11.) Suppose now that your portfolio must yield an expected return of 12% and be efficient that is, on the best feasible CAL. a.) What is the standard deviation of your portfolio? b.) What are the proportion invested in the T-bill fund and each of the two risky funds?

SWFT Essntl Tax Individ/Bus Entities 2020
23rd Edition
ISBN:9780357391266
Author:Nellen
Publisher:Nellen
Chapter2: Working With The Tax Law
Section: Chapter Questions
Problem 1RP

Related questions
Question
A pension fund manager is considering three mutual funds. The first is a stock fund, the second is a long-term bond fund, and the third is a
Expected Return Standard Deviation
Stock fund (S) 15% 32%
Bond fund (B) 9 23
The correlation between the fund returns is .15
11.) Suppose now that your portfolio must yield an expected return of 12% and be efficient that is, on the best feasible CAL.
a.) What is the standard deviation of your portfolio?
b.) What are the proportion invested in the T-bill fund and each of the two risky funds?
Transcribed Image Text:A Voting - Mentimeter
in Course: 21SPR-FIN33 X
Q Chapter 7:Optimal Ris x
O HW4.pdf
O Bodie_Essentials_of_In x
O chapter end questions X
My Questions | bartleb x
- O X
A moodle.uno.edu/pluginfile.php/2607709/mod_resource/content/1/chapter%20end%20questions%20for%20HW4.pdf
1004
ii
PDF
DOC
8 in
chapter end questions for HW4.pdf
2 / 2
100% + | E O
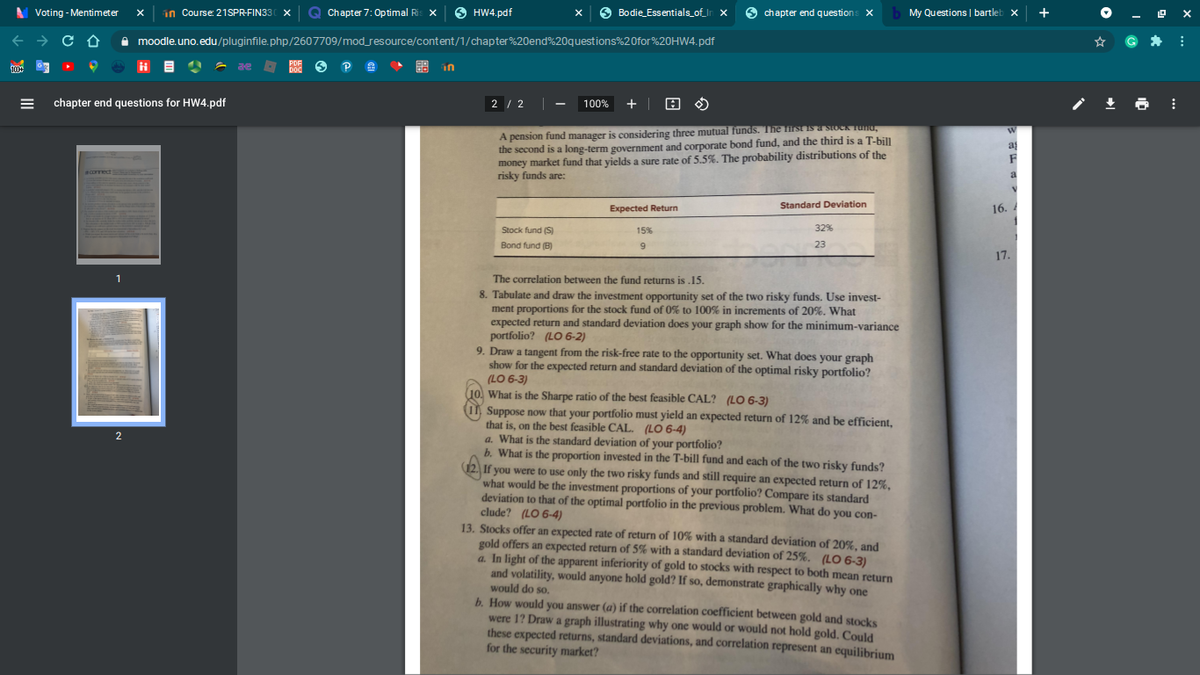
A pension fund manager is considering three mutual funds. The liist is a stock TUNU,
the second is a long-term government and corporate bond fund, and the third is a T-bill
money market fund that yields a sure rate of 5.5%. The probability distributions of the
risky funds are:
a
comect
a
Expected Return
Standard Deviation
16.
Stock fund (S)
15%
32%
Bond fund (B)
9
23
17.
1
The correlation between the fund returns is .15.
8. Tabulate and draw the investment opportunity set of the two risky funds. Use invest-
ment proportions for the stock fund of 0% to 100% in increments of 20%. What
expected return and standard deviation does your graph show for the minimum-variance
portfolio? (LO 6-2)
9. Draw a tangent from the risk-free rate to the opportunity set. What does your graph
show for the expected return and standard deviation of the optimal risky portfolio?
(LO 6-3)
What is the Sharpe ratio of the best feasible CAL? (LO 6-3)
Suppose now that your portfolio must yield an expected return of 12% and be efficient,
that is, on the best feasible CAL. (LO 6-4)
a. What is the standard deviation of your portfolio?
b. What is the proportion invested in the T-bill fund and each of the two risky funds?
12. If you were to use only the two risky funds and still require an expected return of 12%,
what would be the investment proportions of your portfolio? Compare its standard
deviation to that of the optimal portfolio in the previous problem. What do you con-
clude? (LO 6-4)
13. Stocks offer an expected rate of return of 10% with a standard deviation of 20%, and
gold offers an expected return of 5% with a standard deviation of 25%. (LO 6-3)
a. In light of the apparent inferiority of gold to stocks with respect to both mean return
and volatility, would anyone hold gold? If so, demonstrate graphically why one
would do so.
b. How would you answer (a) if the correlation coefficient between gold and stocks
were 1? Draw a graph illustrating why one would or would not hold gold. Could
these expected returns, standard deviations, and correlation represent an equilibrium
for the security market?
2
Expert Solution
This question has been solved!
Explore an expertly crafted, step-by-step solution for a thorough understanding of key concepts.

This is a popular solution!

Trending now
This is a popular solution!

Step by step
Solved in 2 steps with 3 images

Knowledge Booster


Learn more about
Need a deep-dive on the concept behind this application? Look no further. Learn more about this topic, finance and related others by exploring similar questions and additional content below.Recommended textbooks for you