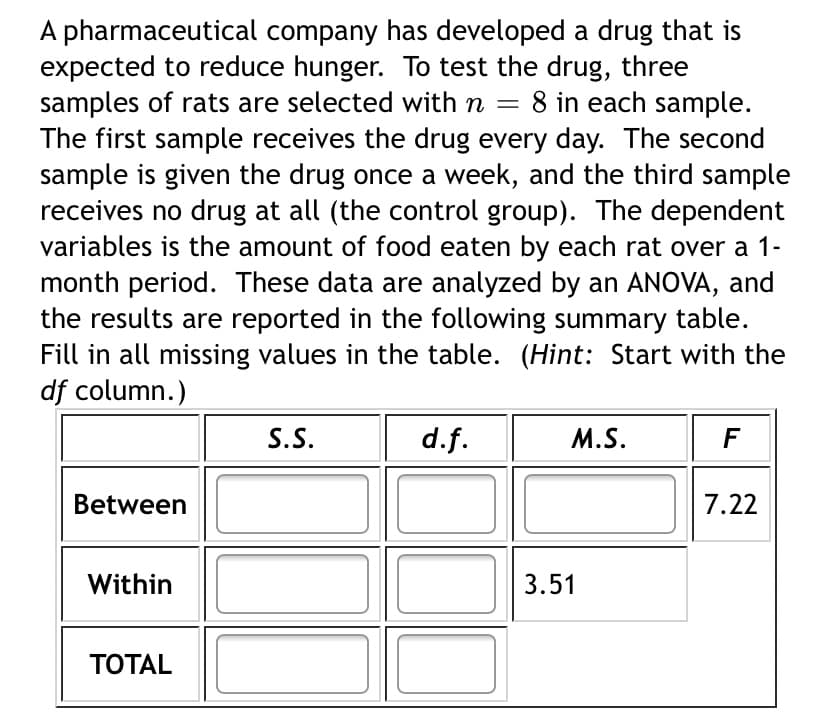
A pharmaceutical company has developed a drug that is expected to reduce hunger. To test the drug, three samples of rats are selected with n = The first sample receives the drug every day. The second sample is given the drug once a week, and the third sample receives no drug at all (the control group). The dependent variables is the amount of food eaten by each rat over a 1- month period. These data are analyzed by an ANOVA, and the results are reported in the following summary table. Fill in all missing values in the table. (Hint: Start with the df column.) 8 in each sample. S.S. d.f. M.S. F Between 7.22 Within 3.51 ТОTAL


Continuous Probability Distributions
Probability distributions are of two types, which are continuous probability distributions and discrete probability distributions. A continuous probability distribution contains an infinite number of values. For example, if time is infinite: you could count from 0 to a trillion seconds, billion seconds, so on indefinitely. A discrete probability distribution consists of only a countable set of possible values.
Normal Distribution
Suppose we had to design a bathroom weighing scale, how would we decide what should be the range of the weighing machine? Would we take the highest recorded human weight in history and use that as the upper limit for our weighing scale? This may not be a great idea as the sensitivity of the scale would get reduced if the range is too large. At the same time, if we keep the upper limit too low, it may not be usable for a large percentage of the population!


Trending now
This is a popular solution!

Step by step
Solved in 2 steps


