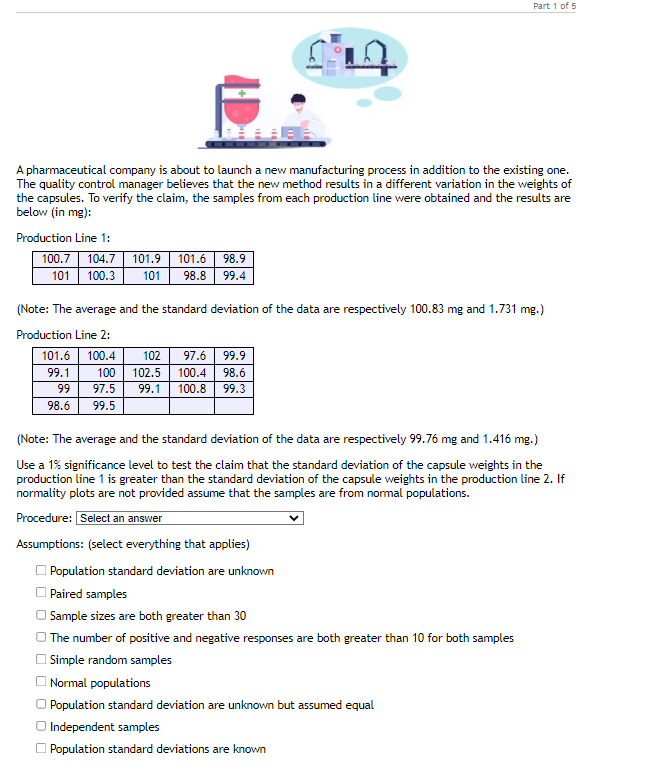
A pharmaceutical company is about to launch a new manufacturing process in addition to the existing one. The quality control manager believes that the new method results in a different variation in the weights of the capsules. To verify the claim, the samples from each production line were obtained and the results are below (in mg): Production Line 1: 100.7 104.7 101.9 101.6 98.9 101 100.3 101 98.8 99.4 (Note: The average and the standard deviation of the data are respectively 100.83 mg and 1.731 mg.) Production Line 2: 101.6 100.4 99.1 100 99 97.5 98.6 99.5 102 97.6 99.9 102.5 100.4 98.6 99.1 100.8 99.3 (Note: The average and the standard deviation of the data are respectively 99.76 mg and 1.416 mg.) Use a 1% significance level to test the claim that the standard deviation of the capsule weights in the production line 1 is greater than the standard deviation of the capsule weights in the production line 2. If normality plots are not provided assume that the samples are from normal populations. Procedure: Select an answer Assumptions: (select everything that applies) Population standard deviation are unknown Paired samples Sample sizes are both greater than 30 The number of positive and negative responses are both greater than 10 for both samples Simple random samples Normal populations Population standard deviation are unknown but assumed equal Independent samples Population standard deviations are known
A pharmaceutical company is about to launch a new manufacturing process in addition to the existing one. The quality control manager believes that the new method results in a different variation in the weights of the capsules. To verify the claim, the samples from each production line were obtained and the results are below (in mg): Production Line 1: 100.7 104.7 101.9 101.6 98.9 101 100.3 101 98.8 99.4 (Note: The average and the standard deviation of the data are respectively 100.83 mg and 1.731 mg.) Production Line 2: 101.6 100.4 99.1 100 99 97.5 98.6 99.5 102 97.6 99.9 102.5 100.4 98.6 99.1 100.8 99.3 (Note: The average and the standard deviation of the data are respectively 99.76 mg and 1.416 mg.) Use a 1% significance level to test the claim that the standard deviation of the capsule weights in the production line 1 is greater than the standard deviation of the capsule weights in the production line 2. If normality plots are not provided assume that the samples are from normal populations. Procedure: Select an answer Assumptions: (select everything that applies) Population standard deviation are unknown Paired samples Sample sizes are both greater than 30 The number of positive and negative responses are both greater than 10 for both samples Simple random samples Normal populations Population standard deviation are unknown but assumed equal Independent samples Population standard deviations are known

Glencoe Algebra 1, Student Edition, 9780079039897, 0079039898, 2018
18th Edition
ISBN:9780079039897
Author:Carter
Publisher:Carter
Chapter10: Statistics
Section10.5: Comparing Sets Of Data
Problem 14PPS

Related questions
Question
Transcribed Image Text:A pharmaceutical company is about to launch a new manufacturing process in addition to the existing one.
The quality control manager believes that the new method results in a different variation in the weights of
the capsules. To verify the claim, the samples from each production line were obtained and the results are
below (in mg):
Production Line 1:
100.7 104.7 101.9 101.6 98.9
101 98.8 99.4
101
100.3
(Note: The average and the standard deviation of the data are respectively 100.83 mg and 1.731 mg.)
Production Line 2:
101.6 100.4
99.1
99
98.6
100
97.5
99.5
102 97.6 99.9
102.5 100.4 98.6
99.1 100.8 99.3
Part 1 of 5
(Note: The average and the standard deviation of the data are respectively 99.76 mg and 1.416 mg.)
Use a 1% significance level to test the claim that the standard deviation of the capsule weights in the
production line 1 is greater than the standard deviation of the capsule weights in the production line 2. If
normality plots are not provided assume that the samples are from normal populations.
Procedure: Select an answer
Assumptions: (select everything that applies)
Population standard deviation are unknown
Paired samples
Sample sizes are both greater than 30
The number of positive and negative responses are both greater than 10 for both samples
Simple random samples
Normal populations
Population standard deviation are unknown but assumed equal
Independent samples
Population standard deviations are known
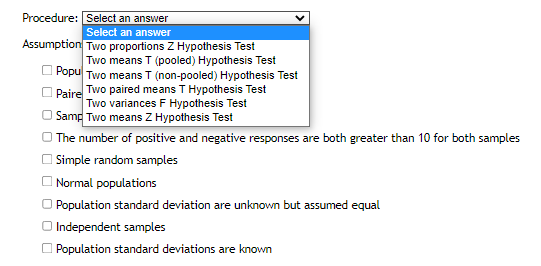
Transcribed Image Text:Procedure: Select an answer
Select an answer
Assumption Two proportions Z Hypothesis Test
Two means T (pooled) Hypothesis Test
Popu Two means T (non-pooled) Hypothesis Test
Paire Two paired means T Hypothesis Test
Two variances F Hypothesis Test
Samp Two means Z Hypothesis Test
The number of positive and negative responses are both greater than 10 for both samples
Simple random samples
Normal populations
Population standard deviation are unknown but assumed equal
O Independent samples
Population standard deviations are known
Expert Solution
This question has been solved!
Explore an expertly crafted, step-by-step solution for a thorough understanding of key concepts.

This is a popular solution!

Trending now
This is a popular solution!

Step by step
Solved in 2 steps

Follow-up Questions
Read through expert solutions to related follow-up questions below.
Follow-up Question

Transcribed Image Text:Step 1. Hypotheses Set-Up:
Ho: Select an answer
Ha: Select an answer
Step 2. The significance level =
Provide the critical value(s) for the Rejection Region:
left CV is
and right CV is
Step 5. Decision:
where Select an answer the
Select an answer
units are Select an answer
Step 3. Compute the value of the test statistic: Select an answer
decimal places)
Step 4. Testing Procedure: (Round the answers to 3 decimal places)
CVA
Is the test statistic in the rejection region?
?
Conclusion: Select an answer
.
and the test is Select an answer
Step 4. Testing Procedure: (Round the answers to 3 decimal places)
CVA
Step 6. Interpretation:
1%
At % significance level we [Select an answer
hypothesis in favor of the alternative hypothesis.
E
and the
(Round the answer to 3
PVA
Compute the P-value of the test
statistic:
P-value is
PVA
Is the P-value less than the significance level?
have sufficient evidence to reject the null
11:19 AM
7/11/2020
Solution
Recommended textbooks for you
Glencoe Algebra 1, Student Edition, 9780079039897…
Algebra
ISBN:
9780079039897
Author:
Carter
Publisher:
McGraw Hill
Glencoe Algebra 1, Student Edition, 9780079039897…
Algebra
ISBN:
9780079039897
Author:
Carter
Publisher:
McGraw Hill