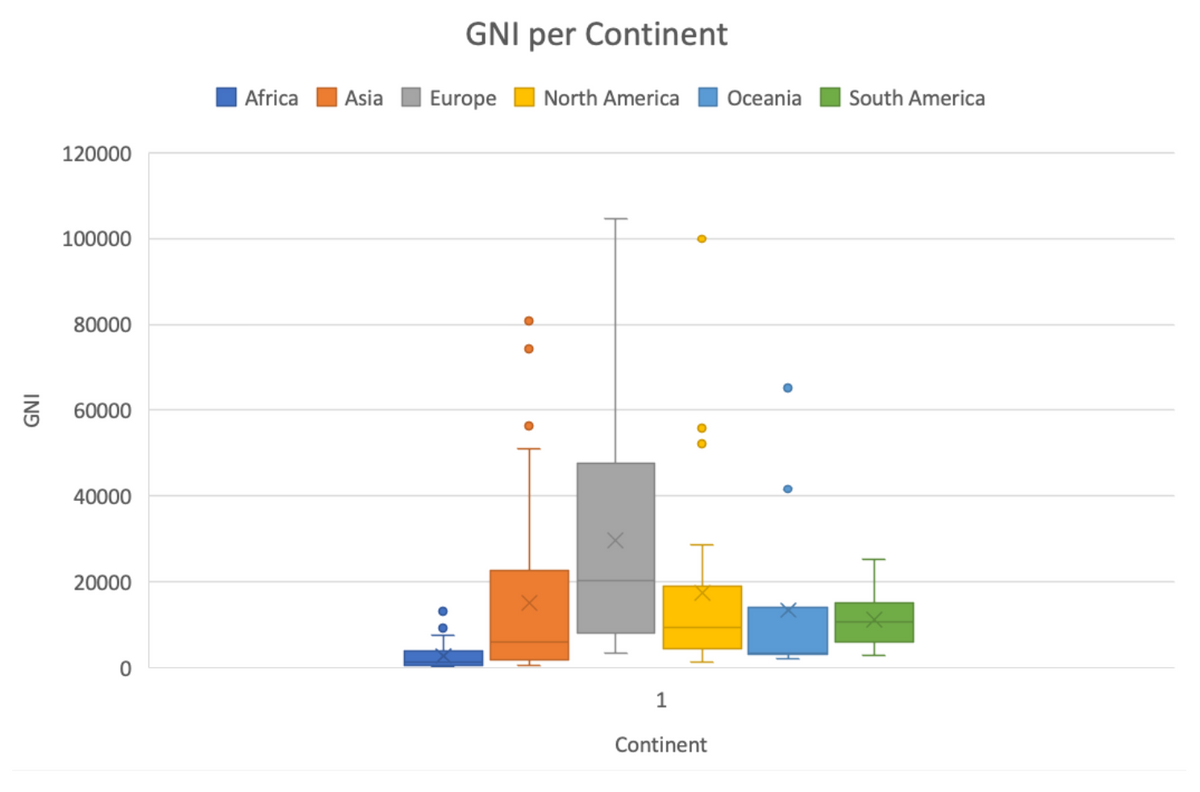
Compare the centres and spreads of the distributions. In particular, rank the continents from highest to lowest based on their median GNI.


Q: se the given data to find the equation of the regression line. Examine the scatterplot and entify a…
A: Data given X:5,7,9,8,12,3,11,13,4,10,6…
Q: A recent survey of 2500 college students revealed that during any weekend afternoon, 1112 receive a…
A:
Q: What is the null hypothesis for a two-tailed test of Pearson's r correlation coefficient and how is…
A: Given that We have to develop the null hypothesis for a two-tailed test of Pearson's r correlation…
Q: The distribution of blood types for 100 Americans is listed in the table. If one donor is selected…
A: Given that Total number of 100 Americans. We have to find probability of AB-
Q: For item 15 and 16. Which of the given variables can stand as 15. dependent variable Total revenue O…
A: Introduction A variable is a characteristic that can be measured.
Q: The second question wasn't answered.
A: Probability is the measure of the chance that an event is likely to happen. It is calculated by…
Q: researcher wants to compare the effectiveness of three different teaching methods (A, B, and C) on…
A: We have to determine which test can we use for the given situation.
Q: symmetric (there is mild right skewness), it is close enough to being symmetric and mound-shaped to…
A: Given that Mean=M=1079, Standard deviation =Sd=309 P(X>461)=P(X>1079-2×309) =P(X>μ-2σ)…
Q: Circle the correct answer for each question and give a one-line explanation for each: a) For the…
A: Given that a) For the normal density curve, the median is (greater than, equal to, less than) the…
Q: 24. Consider the boxplots from three samples in Figure 7.6. Sample 3 Sample 2 Sample 1 Figure 7.6:…
A: The five-number summary of a set of data is displayed in a boxplot as Min, Q1, Q2, Q3, Max. The end…
Q: Let X= [X₁, X₂, X₁' be a random vector with mean vector = [4, 3, 2]' and correlation matrix [16 4…
A:
Q: Step 1, Hypothesis Test for Correlation Hypotheses - Requirements. Look at a scatterplot such as the…
A: The hypothesis for the correlation test is as follows. H0: ρ=0H1: ρ≠0 The null hypothesis stated…
Q: ales that average delly high temperature in June in a particular city with a standard deviation of…
A: Given Information: The average daily temperature in June in a particular day is 86°F with a standard…
Q: 1 3 w 2 In some board games, you move your marker a certain number of spaces based on the result of…
A: The notion of probability is a central concept in statistics. The classical definition of…
Q: Assume that the readings at freezing on a batch of thermometers are normally distributed with a mean…
A:
Q: Sound travels about 750 miles per hour. If you stand in a canyon and sound a horn, you will hear an…
A: To find the distance of the canyon wall, we can use the formula: distance = speed of sound * time.…
Q: b)Consider failure times in hours from two populations ₁ and π₂ as given below. π1 TT2. 11 2₁ 3, 5,…
A: Given the failure times in hours from two populations π1 and π2 as π1 : 2, 3, 5, 5, 5*, 7, 8*,…
Q: High blood pressure is unhealthy. Here are the results of one of the studies that link high blood…
A:
Q: Cost of breakfast. Sally gets a cup of co↵ee and a muffin every day for breakfast from one of the…
A: Given Information: The average price of a cup of coffee is $1.40 with standard deviation of 30¢…
Q: A probability model is simply a list of outcomes and the probability of each outcome. Which of the…
A: We know that the probability model satisfy the following conditions; All the probabilities in the…
Q: Which values are suspected outliers by the 1.5 × ???1.5 × ��� rule? Give your answer in the form…
A: The first quartile is 19, third quartile is 26.5.
Q: The original scatterplot of y vs. x looks like this: The slope of a simple linear regression line…
A: A scatterplot is a graphical representation that indicates the relationship between two variables x…
Q: Let X and Y have the pdf f(x, y) = 1, 0 < x, y < 1, zero elsewhere. (a) Find the cdf of the product…
A: Here X and Y have the pdf, fx,y=1, 0<x,y<1=0, elsewhere Now if z≤0, then Fz=PZ≤z=0, because…
Q: A stastacian wants to determine if there is a significant difference in the average math scores of…
A: From the provided information, n1=50x1=85s1=4n2=50x2=80s2=3 Level of significance (α) = 0.01
Q: QUESTION 11 The change in smell sensation attributed to COVID-19 by smoking status in a sample of…
A: Given that Smoker=52+8+50=110 Moderate reduction=38+8=46 Smoker and moderate reduction=8…
Q: The promotional accounts show a O bimodal O unimodal O multimodal O no mode distribution.
A: It is given that the data shows the relationship between sales for a particular year and factors…
Q: Hypothesis Test for the Difference Between Two Population Means You were asked to compare your…
A: Given The data is as follows: α=0.01 Avg. relative skill of the team in the years 2013 to 2015,…
Q: A production supervisor at a major chemical company wishes to determine whether a new catalyst,…
A: Solution: Given information of pilot study is n= 5 Sample size s= 19.00 Sample standard deviation…
Q: You want to put a 2 inch thick layer of topsoil for a new 31 ft by 24 ft garden. The dirt store…
A: Given data : 2 inch thick layer Garden = 31ft by 24ft 1/4 cubic yard
Q: I don't understand question a.
A: Here is the given bar graph of the population of the United States by race
Q: On a scale of 0 to 10, a college student rated her enjoyment of statistics as a 7. The average…
A: Let a collage student rated her enjoyment of statistics as a 7. The average rating among college…
Q: A survey was conducted to determine the difference in the average height of adult males before and…
A:
Q: A) Using the neck sizes of the shirts of the 100 college students in the DO NOW - μ-20 inches o-…
A: (A) Find the neck size of a student above 2 standard deviation above the mean. From the information,…
Q: Let X = number of email you receive in an hour. Assume that X follows the Poisson distribution with…
A: The random variable X is the number of emails you receive in an hour. X~P(λ=5) The p.m.f. of the…
Q: The waiting line at a popular bakery shop can be quite long. Suppose that the waiting time in…
A:
Q: In each of the following cases, find the mean, variance, and standard deviation of the sampling…
A: we have to find the mean, variance, and standard deviation of the sampling distribution of the…
Q: A random sample of 10 parking meters in a resort community showed the following incomes for a day.…
A: The question is about confidence interval Given : To find : 95 % CI for the true mean
Q: Question: A sample of 200 customers was surveyed to find their favorite brand of soft drink. The…
A: Given data is Brand Frequency Brand A 60 Brand B 40 Brand C 30 Brand D 30 Brand E 50
Q: A study was done on the timeliness of flights categorized as either "on time" or "delayed" of two…
A: Given that The study is done on the timeliness of flights of two major airlines. The airlines are…
Q: The sampling distribution of the difference of two sample proportions is approximated by a a. normal…
A: Answer:- we know that, The sampling distribution of the difference between two independent sample…
Q: b) c) Explain to Xuemei why the portfolio standard deviation is not simply the weighted average of…
A: The portfolio is the larger range of investments made by the investors. Expected portfolio return…
Q: Football coaches running their summer practices noticed that the players who weighed more typically…
A: The claim is players who weighted typically more had slower times for their 40-yard dash There are…
Q: A probability model is simply a list of outcomes and the probability of each outcome. Which of the…
A: Answer:- We know that , The probability of the outcome of an experiment is never negative . and the…
Q: Describe each of the 3 of your variables (two independent and one dependent) by calculating and…
A: Given Dependent variable Years Independent Variable Homicides Computing 1 measures of…
Q: Soft Shoes, a shoe store, sold $1,528 pairs of blue slippers last week. If that amount is 11.5% of…
A: We have given, A shoe store sold $1528 pairs of blue slippers last week. And their total sales from…
Q: besity is an important determinant of cardiovascular disease because it directly affects several…
A: Hi! Thank you for the question. As per the honor code, we are allowed to answer three sub-parts at a…
Q: A shipment of 5 television sets contains 2 defective sets. A hotel makes a random purchase of 2 of…
A: Answer:- Given , Sample size (n) = 2 Population size (N) = 5 Success size (k) = 2 Using formula,…
Q: A researcher claims that the average time people spend commuting to work is more than 25 minutes. To…
A: To test the hypothesis, we can use a one-sample t-test. The null hypothesis is that the average time…
Q: What is the average weight of a group of 100 individuals who weigh between 140 and 220 pounds,…
A: The average weight can be calculated by summing up the weights of all 100 individuals and dividing…
Q: What is the equation of a simple linear regression model with one independent variable x and one…
A: Givenx is a independent variable y is a dependent variableSlope(b1)=0.5y-intercept(b0)=2
Compare the centres and spreads of the distributions. In particular, rank the continents from highest to lowest based on their median GNI.

Step by step
Solved in 2 steps

- Calculate 1 + 2/10 + 3/100 + 7/1000 + 2/10000 + 3/100000 + 7/1000000 + ....Mag Depth 2.96 19.9 2.73 6.5 1.46 3.5 0.85 13.3 2.95 19.9 1.63 8.7 1.92 18.4 1.12 7.9 2.59 3.1 1.68 9.4 0.14 6.2 2.43 17.7 0.04 18.4 1.03 9.8 2.89 12.4 0.54 9.5 0.77 2.1 1.87 8.1 2.72 17.3 0.84 9.9 1.48 12.7 0.68 7.1 1.83 17.1 1.89 3.4 0.94 13.8 2.24 5.7 0.94 16.7 1.36 5.2 0.98 6.6 0.51 12.5 2.69 14.1 1.73 12.5 2.29 12.7 1.63 14.7 0.52 18.6 2.75 4.5 2.31 10.5 1.39 13.3 2.05 10.5 0.63 5.7 1.15 3.6 1.59 2.9 2.92 11.3 0.33 6.4 2.78 9.2 1.43 4.8 0.82 4.8 0.21 13.6 1.77 12.3 0.68 4.9 1) Check Image 2) Given that the earthquake has a magnitude of 1.1, the best predicted depth is km. (Round to one decimal place as needed.)ɪɪɪ.ʟᴇᴛ ꜰ ᴀɴᴅ ꜱ ʙᴇ ᴛʜᴇ ᴘʀᴏᴘᴏꜱɪᴛɪᴏɴꜱʜ : ɪᴛ ɪꜱ ꜱᴄᴏʀᴄʜɪɴɢ ʜᴏᴛ.ꜱ : ɪᴛ ɪꜱ ꜱᴜᴍᴍᴇʀ ᴀʟʀᴇᴀᴅʏ. ᴡʀɪᴛᴇ ᴛʜᴇꜱᴇ ᴘʀᴏᴘᴏꜱɪᴛɪᴏɴꜱ ᴜꜱɪɴɢ ʜ ᴀɴᴅ ꜱ, ᴀɴᴅ ʟᴏɢɪᴄᴀʟ ᴄᴏɴɴᴇᴄᴛɪᴠᴇꜱ 1. ᴇɪᴛʜᴇʀ ɪᴛ ɪꜱ ꜱᴄᴏʀᴄʜɪɴɢ ʜᴏᴛ ᴏʀ ɪᴛ ɪꜱ ꜱᴜᴍᴍᴇʀ ᴀʟʀᴇᴀᴅʏ, ʙᴜᴛ ɪᴛ ɪꜱ ɴᴏᴛ ꜱᴄᴏʀᴄʜɪɴɢ ʜᴏᴛ ɪꜰ ɪᴛ ɪꜱꜱᴜᴍᴍᴇʀ ᴀʟʀᴇᴀᴅʏ.
- Mag Depth 2.62 7.6 0.94 15.9 0.64 11.5 1.94 12.1 0.51 19.5 1.45 18.1 2.25 6.9 1.27 10.4 2.89 17.9 0.61 13.3 0.17 19.9 2.15 3.9 1.88 5.6 2.35 4.7 1.43 5.6 2.32 8.3 2.61 18.1 0.47 2.6 2.39 14.6 0.59 13.9 0.29 18.1 2.36 18.2 0.31 9.7 0.26 3.5 0.59 9.9 1.96 18.6 2.56 14.2 0.45 19.6 1.48 5.4 0.96 9.4 1.28 10.5 2.17 16.6 1.58 16.1 1.76 11.3 0.93 3.9 1.88 3.2 2.01 6.8 2.41 11.5 0.48 19.4 2.39 2.2 1.31 12.3 2.68 13.9 0.61 15.6 1.97 8.6 2.58 6.5 1.25 3.5 0.69 13.1 2.45 19.8 1.02 8.2 0.72 6.9Calculate SSTnew is
