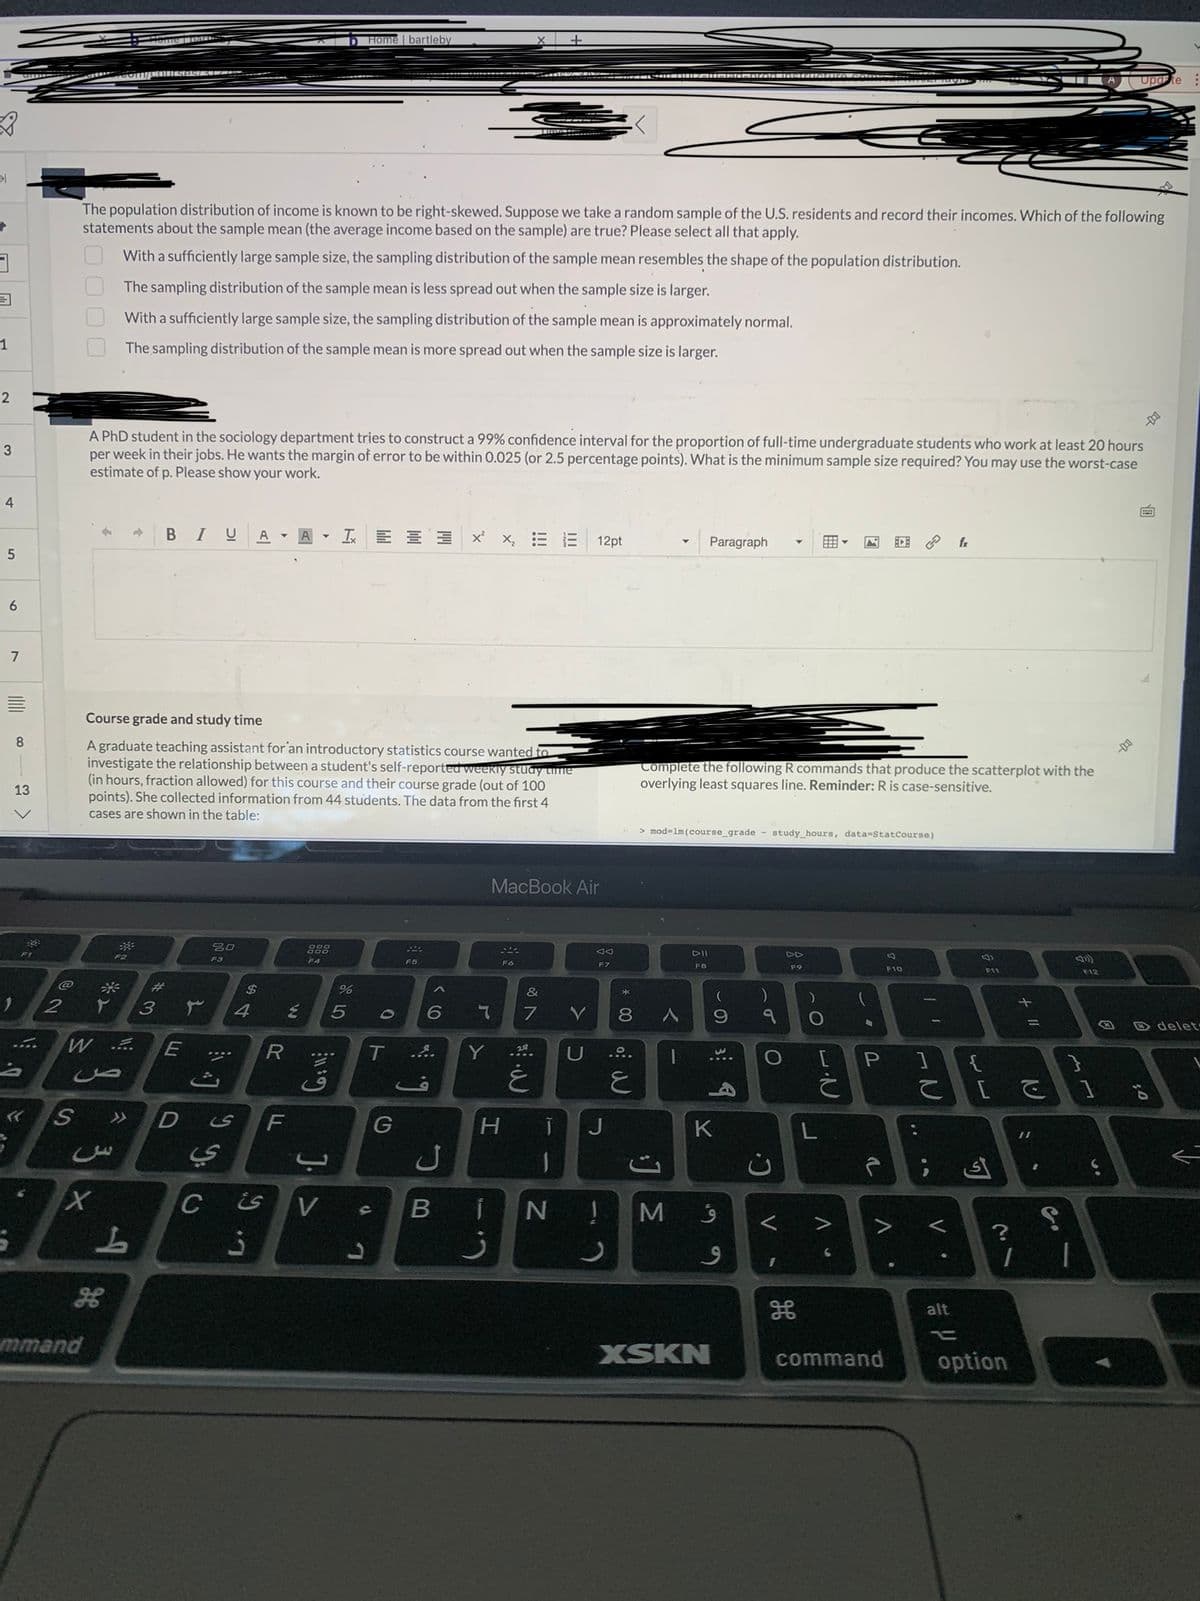
A PhD student in the sociology department tries to construct a 99% confidence interval for the proportion of full-time undergraduate students who work at least 20 hours per week in their jobs. He wants the margin of error to be within 0.025 (or 2.5 percentage points). What is the minimum sample size required? You may use the worst-case estimate of p. Please show your work.
A PhD student in the sociology department tries to construct a 99% confidence interval for the proportion of full-time undergraduate students who work at least 20 hours per week in their jobs. He wants the margin of error to be within 0.025 (or 2.5 percentage points). What is the minimum sample size required? You may use the worst-case estimate of p. Please show your work.

Holt Mcdougal Larson Pre-algebra: Student Edition 2012
1st Edition
ISBN:9780547587776
Author:HOLT MCDOUGAL
Publisher:HOLT MCDOUGAL
Chapter11: Data Analysis And Probability
Section11.5: Interpreting Data
Problem 13E

Related questions
Question
What is the minimum
Transcribed Image Text:31
3
1
2
3
4
5
6
7
100
E
8
13
0.
2
0000
The population distribution of income is known to be right-skewed. Suppose we take a random sample of the U.S. residents and record their incomes. Which of the following
statements about the sample mean (the average income based on the sample) are true? Please select all that apply.
With a sufficiently large sample size, the sampling distribution of the sample mean resembles the shape of the population distribution.
The sampling distribution of the sample mean is less spread out when the sample size is larger.
With a sufficiently large sample size, the sampling distribution of the sample mean is approximately normal.
t
mmand
A PhD student in the sociology department tries to construct a 99% confidence interval for the proportion of full-time undergraduate students who work at least 20 hours
per week in their jobs. He wants the margin of error to be within 0.025 (or 2.5 percentage points). What is the minimum sample size required? You may use the worst-case
estimate of p. Please show your work.
The sampling distribution of the sample mean is more spread out when the sample size is larger.
W ....
F2
ص
3 ×
B IU A
Course grade and study time
A graduate teaching assistant for an introductory statistics course wanted to
investigate the relationship between a student's self-reported weekly study time
(in hours, fraction allowed) for this course and their course grade (out of 100
points). She collected information from 44 students. The data from the first 4
cases are shown in the table:
S >> D
L
#3
E
20
F3
****
is
ي
$
4
C is
3
R
A
F
Y
F4
1 Home | bartleby
E 5
G:11:
J. >
%
V s
L
0
3 x²x₂ E
T ...
G
6
ل
s
Y
MacBook Air
S44
Fó
H
&
7
غ
T
BIN
Y
12pt
D
Ad
F7
J
!
mio
8 A
E
Complete the following R commands that produce the scatterplot with the
overlying least squares line. Reminder: R is case-sensitive.
> mod-1m (course_grade study_hours, data-StatCourse)
M
Paragraph
DII
FB
K
XSKN
(
)
9 १ O
4
9
9
C²
<
FO
I
A
8
F10
command
A
| T
P 1
IN
C
V.
fr
alt
F11
{
[
أى
?
1
option
S
1 1
Update
F12
;0
delet
Expert Solution
This question has been solved!
Explore an expertly crafted, step-by-step solution for a thorough understanding of key concepts.

Step by step
Solved in 2 steps with 1 images

Recommended textbooks for you
Holt Mcdougal Larson Pre-algebra: Student Edition…
Algebra
ISBN:
9780547587776
Author:
HOLT MCDOUGAL
Publisher:
HOLT MCDOUGAL
Holt Mcdougal Larson Pre-algebra: Student Edition…
Algebra
ISBN:
9780547587776
Author:
HOLT MCDOUGAL
Publisher:
HOLT MCDOUGAL