A pilot study is conducted to investigate the effect of a nutritional supplement on total body weight. Nine participants agree to take the nutritional supplement. To assess its effect on body weight, weights are measured before starting the supplementation and then after 6 weeks. The data are shown below. Is there a difference in body weight following supplementation? Run the test at a 5% level of significance. Give each of the following: 1) the appropriate null and alternative hypotheses; 2) the appropriate test; 3) the decision rule; 4) the calculation of the test statistic; and 5) your conclusion including a comparison to alpha or the critical value. You MUST show your work Subject Initial Weight Weight after 6 Weeks 1 155 157 2 142 145 3 176 180 4 180 175 5 210 209 6 125 126 7 195 187 8 187 181 9 159 155


A pilot study is conducted to investigate the effect of a nutritional supplement on total body weight. Nine participants agree to take the nutritional supplement. To assess its effect on body weight, weights are measured before starting the supplementation and then after 6 weeks. The data are shown below. Is there a difference in body weight following supplementation? Run the test at a 5% level of significance. Give each of the following: 1) the appropriate null and alternative hypotheses; 2) the appropriate test; 3) the decision rule; 4) the calculation of the test statistic; and 5) your conclusion including a comparison to alpha or the critical value. You MUST show your work
|
Subject
|
Initial Weight
|
Weight after 6 Weeks
|
|
1
|
155
|
157
|
|
2
|
142
|
145
|
|
3
|
176
|
180
|
|
4
|
180
|
175
|
|
5
|
210
|
209
|
|
6
|
125
|
126
|
|
7
|
195
|
187
|
|
8
|
187
|
181
|
|
9
|
159
|
155
|
(1)
Here, the claim of the test is that there is a difference in body weight following supplementation.
The hypotheses are given below:
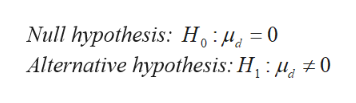
(2)
Here, the samples are dependent. Hence, paired t test is appropriate.
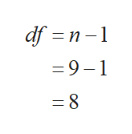
(3)
The degrees of freedom is,
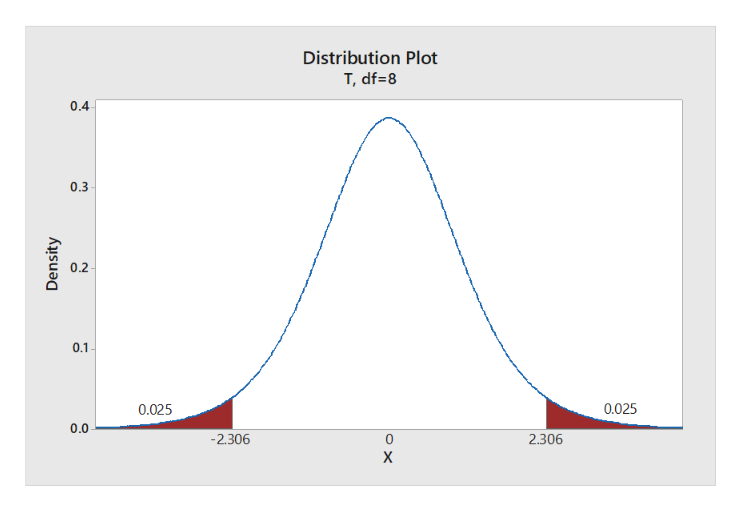
Step-by-step procedure to obtain the critical value using MINITAB software:
- Choose Graph > Probability Distribution Plot choose View Probability > OK.
- From Distribution, choose ‘t’ distribution.
- In Degrees of freedom, enter 8.
- Click the Shaded Area
- Choose Probability and both Tail for the region of the curve to shade.
- Enter the Probability as 0.05.
- Click OK.
Output obtained using MINITAB software is given below:

Trending now
This is a popular solution!

Step by step
Solved in 5 steps with 4 images


