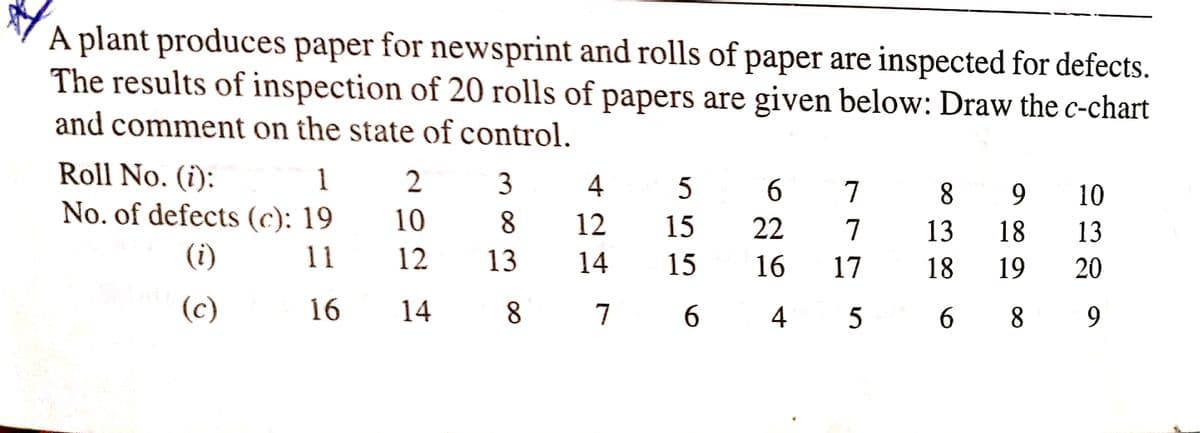
A plant produces paper for newsprint and rolls of paper are inspected for defects. The results of inspection of 20 rolls of papers are given below: Draw the c-chart and comment on the state of control. Roll No. (i): No. of defects (c): 19 1 2 3 4 5 6. 7 8 9 10 10 8 12 15 22 7 13 18 13 (i) 11 12 13 14 15 16 17 18 19 20 (c) 16 14 8 7 6. 4 5 6. 8. 9


Q: A sample has a mean M = 55. For the sample, the standard deviation is ? = 12 and the score correspon...
A:
Q: What is the chance that : (i) a leap year selected at random will contain 53 Sundays, (ii) a non-lea...
A: Solution is given:
Q: The professor of a introductory calculus class has stated that, historically, the distribution of fi...
A: As per our guidelines we are supposed to answer only 3 sub-parts (if there are multiple sub-parts as...
Q: Problem 11: A 95% confidence interval for the population mean GPA of students who passed STAT 361 is...
A: Given that, 95% confidence interval for the population mean GPA of students who passed STAT 361 is g...
Q: Find z such that 6% of the standard normal curve lies to the right of z. (Round your answer to two d...
A: Required probability is P(Z>z0)=0.06
Q: 10. Z is a standard normal random variable. The P(z> 2.23) equals A. 0.0129 В. 0.9821 C. 0.5 D. 0.01...
A: According to the given information in this question Z is the standard normal random variable We need...
Q: III. The ages of qualified voters in a certain barangay were taken and are shown below Frequency 20 ...
A: Using the given age of voters in terms of the interval, and the frequency distribution for the voter...
Q: The Ergonomics Company wants to make a product called Helmets for its employees who won the quiz in ...
A: The mean head width and SD of employees is 18.06 cm and 2.69 cm respectively. we have to calculate 9...
Q: A pair of dice is rolled once what is the probability of getting (i) a total of 6 (11) a total of 13
A: if a coin is tossed 2 times than the possible outcomesare 36i.e 1,11,21,31,41,51,62,12,22,32,42,52,6...
Q: Give an example of a sample space 2. Find two different probability measures 1 and Q on 2. Define a ...
A:
Q: III. Solve the problem below. (Show your solution.) 1. A normal distribution of scores has a standar...
A: “Since you have asked multiple questions, we will solve the first question for you. If you want any ...
Q: A 76% of owned dogs in the United States are spayed or neutered. Round your answers to four decimal ...
A:
Q: Find the 60th percentile of the distribution having pdf f(x)=|x|/4, where -2<x<2
A: Find 60th percentile
Q: Assume that the probability of a being born with Genetic Condition B isp 59/60. A study looks at a r...
A: Givenprobbaility of a being born with genetic condition B (p)=5960sample size(n)=826
Q: Calculate the upper bound of the 95% confidence interval for the population mean weekday sleep time ...
A:
Q: Videotapes. 30 41 28 14 40 36 38 24 61 36 24 45 38 43 32 28 37 34 20 23 34 47 25 31 39 14 43 40 29 2...
A: Given: score result for group that viewed relaxation 30,61,37,39,41,36,34,14,28,24,20,43,14,45,23,40...
Q: The prime Minister of a small Caribbean Island stated that 95% of the population was vaccinated fro...
A:
Q: 3. In each of the following figures, find the probability that a randomly chosen point lies in the s...
A: For figure 1, Since radius of circle =5 Then circumference =2*3.14*5 = 31.4 Perimeter of square = 2a...
Q: Find the correlation co-efficient between X and Y, which are jointly normally distributed with 1 1 x...
A:
Q: The arithmetic mean and standard deviation of a series of 20 items were calculated by a student as 2...
A: We have given that the arithmetic mean and standard deviation of a series of 20 items were calculate...
Q: Im having trouble understanding how to do this. Can someone help me out? Tjabk
A: Given The data is as follows: n non-conforming 400 12 400 10 400 8 400 14 400 21 400...
Q: For a population with = 75 and = 12, Find the z-scores that correspond to each of the following X...
A: 1. Consider that the mean and standard deviation of a random variable x are µ and σ, respectively. T...
Q: X 2 4 P(X) 0.08 0.11 0.238 0.324 0.248 a) Compute and the mean of the random variable X. b) Compute ...
A: We have given that in the probability distribution, the random variable X represents the number of a...
Q: A card is drawn from a full pack. Find the probability that it a King or a Queen
A:
Q: car arrives at a traffic light. Let R = the light being red and H = the cars headlights being on. Th...
A: Given problems related to events and probability. We have to solve both the problems.
Q: The table below shows the results of two variables (A and B). We would ike to know if variable A was...
A: For the given data Perform Chi square test
Q: 4. A certain brand of upright freezer is available in three different rated capacities: 16 ft3 ,18ft...
A: For the given data Find ( a )and (b )
Q: Ise the following data, which represent the English placement test scores of a sample of 30 students...
A: Here we have to construct frequency distribution of a given data with a first class of 472-492.
Q: The following Minitab display gives information regarding the relationship between the body weight o...
A: In the given problem the MINITAB output for the relationship between the body weight of a child and ...
Q: Below are percentages for annual sales growth and net sales attributed to loyalty card usage at 74 N...
A: Given that The excel output of the problem is
Q: S LO Assume that a procedure yields a binomial distribution with n = 771 trials and the probability ...
A:
Q: Refer to the technology output given to the right that results from measured hemoglobin levels (g/d...
A: Given n=100 Alpha=95%
Q: stochastic process 1. Determine the stochastic process that occurs for 1a and 1b, regarding the expe...
A:
Q: 71% of all students at a college still need to take another math class. If 43 students are randomly ...
A:
Q: Complete the following probability distribution table: Probability Distribution Table X. -20 (X) 0.1...
A:
Q: Over a 4-month period, among 30 people with bipolar disorder, patients who were given a high dose (1...
A:
Q: Packages of Lay's Potato Chips have a population standard deviation of 0.16 ounces An SRS of 100 bag...
A: We have given that packages of Lay's Potato Chips have a population standard deviation of 0.16 ounce...
Q: Eight competitors in a voice test are ranked by two judges in the following order Competitors A CDE ...
A:
Q: If x is normally distributed with mean 12 and standard deviation 2, then P(x<9) is P(z< 9/10). P(z<-...
A: Given that Let X be the random variable with Mean =12 Standard deviation =2 Then we have to find P...
Q: 3. A study on the length of a certain type of bacteria was conducted. The table below shows the data...
A: The objective is to compute three quartiles for given data .
Q: For a standard normal distribution, find: P(-2.96 < z < 0.27) Express the probability as a decimal r...
A:
Q: The recidivism rate for convicted sex offenders is 8%. A warden suspects that this percent is differ...
A: Given,n=321x=22p^=xnp^=22321=0.0685α=0.01
Q: You are given the sample mean and the population standard deviation. Use this information to constr...
A: For the given data Find The 90% confidence interval for the population mean. Construct a 95% con...
Q: A group of students in your intro stats class design an experiment to test whether popcorn stored in...
A:
Q: Q.4: Solve the following problem: 20 samples of manufactured pipe were inspected to measure the exte...
A: The objective is to construct frequency table and find mean , variance,SD.
Q: When taking a 32 question multiple choice test, where each question has five possible answers, it wo...
A:
Q: The prime Minister of a small Caribbean Island stated that 95% of the population was vaccinated fr...
A: For the given data Find i. Calculate a 99% confidence interval for the true proportion of all citize...
Q: (a) Suppose you are given the following (x, y) data pairs. 1 6 y 4 3 9. A USE SALT Find the least-sq...
A:
Q: A sample of size n= 55 is drawn from a normal population. The sample mean is x 56.6 and sample stand...
A: Sample size (n) = 55 Sample mean (x̅) = 56.6Standard deviations (s) = 9.2Significance level (α) = 1 ...
Q: In each case, use the information given to compute a confidence interval for the population mean u. ...
A: As per bartleby guideline expert have to answer first three subparts only dear student please upload...

Step by step
Solved in 3 steps with 3 images

- The British Department of Transportation studied to see if people avoid driving on Friday the 13th. They did a traffic count on a Friday and then again on a Friday the 13th at the same two locations. The data for each location on the two different dates is in the table. Do the data show that on average fewer people drive on Friday the 13th? Test at the 5% level.Traffic Count Dates 6th 13th 1990, July 137669 135825 1990, July 129699 128891 1991, September 136898 138275 1991, September 138966 139940 1991, December 132021 129640 1991, December 119268 119214 1992, March 131938 131104 1992, March 123306 124760 1992, November 129499 129219 1992, November 138568 135934A consumer group is investigating a producer of diet meals to examine if its prepackaged meals actually contain the advertised 6 ounces of protein in each package. Based on the following data, is there any evidence that the meals do not contain the advertised amount of protein? Run the appropriate test at a 5% level ofThe following table shows the results of a screening test hypothesized to detect persons at risk for side effects of a new cosmetic surgery. Compute the specificity of the test. Side effects present Side effects absent Screen positive 12 6 Screen negative 85 204
- Biostatistics Outpatients (N = 36) with type 2 diabetes were referred back to the hospital because of the risk of developing chronic kidney disease (CKD) (possible kidney failure). During their follow-up, some patients were diagnosed with advanced (or end-stage) CKD, requiring an extension of their stay in the hospital, while others were readmitted for further medical assessment. Throughout the study, mortality and hospitalization rates, as well as bio-chemical lab test results, were reported. In addition, the attached data slice contains additional demographic data about the patient group. Q1: Write demographic and lifestyle summary with appropriate statistical tools of descriptive statistics that include Age(years), Gender, Level of deprivation [Townsend or socio-economical status SES], and Marital status.Biostatistics Outpatients (N = 36) with type 2 diabetes were referred back to the hospital because of the risk of developing chronic kidney disease (CKD) (possible kidney failure). During their follow-up, some patients were diagnosed with advanced (or end-stage) CKD, requiring an extension of their stay in the hospital, while others were readmitted for further medical assessment. Throughout the study, mortality and hospitalization rates, as well as bio-chemical lab test results, were reported. In addition, the attached data slice contains additional demographic data about the patient group. Q2: Write a statistical summary for patients’ health status that include Smoking status, Glucose level (mmol/L), C-reactive protein (CRP) (mg/L), Blood urea (mmol/L), Serum creatinine (μmol/L), and Albumin level (g/L).A nationwide study of undergraduate students reported that the mean number of drinks consumed per week during the spring semester is 7.96. The mean number of drinks consumed per week at USC is 7.64 (s.d.=2.55, N=412 Health services is concerned that USC students are consuming significantly more alcohol per week than the national average. Using an alpha level of .05, Is there sufficient evidence to be concerned? Be sure to select the correct critical value for the alternative hypothesis, and then use this evidence to make your conclusion
- The number of contaminating particles on a silicon waferprior to a certain rinsing process was determined for eachwafer in a sample of size 100, resulting in the followingfrequencies:Number of particles 0 1 2 3 4 5 6 7Frequency 1 2 3 12 11 15 18 10Number of particles 8 9 10 11 12 13 14Frequency 12 4 5 3 1 2 1a. What proportion of the sampled wafers had at leastone particle? At least five particles?b. What proportion of the sampled wafers had betweenfive and ten particles, inclusive? Strictly between fiveand ten particles?c. Draw a histogram using relative frequency on thevertical axis. How would you describe the shape of thehistogram?You are using a z-test to test H0: u=413 vs Ha: u<413 at the a=.1 level. What would the rejection region be for this test?A study was conducted to examine if children with autism spectrum disorder (ASD) had higher prenatal exposure to air pollution, specifically particulate matter < 2.5 g in diameter (PM2.5). Researchers obtained birth records of all children born in Los Angeles between 2000 and 2008 and linked these to the Department of Developmental Services records to determine if any of those subjects had been diagnosed with ASD or not. They used the birth addresses given in the birth records to determine the average daily PM2.5 for the third trimester for each child. The standard deviation for PM2.5 among ASD subjects was found to be 34.6 and for non-ASD subjects was 16.8. Assume PM2.5 is normally distributed. 4a. What was the study design? * Randomized Clinical Trial (RCT) * Case Report * Nested Case-Control Study * Case-Control Study * cross-sectional study Cohort Study 4B. What are the null and alternative hypotheses? 4c. What type of statistical test would you use to analyze the…
- A travel association says the daily lodging costs for a family in the United States is $132. You work for a tourist publication and want to test this claim. You randomly selected 10 U.S. families and find out how much each spent on lodging for one overnight trip. At alpha=0.02, can you reject the travel association's claim? (Adapted from the American Automobile Association) 164 137 142 155 119 104 74 204 148 181 Assume the population is normally distributed.Suppose a researcher is interested inthe effectiveness in a new childhood exercise program implemented in a SRS of schools across a particular county. In order to test the hypothesis that the new program decreases BMI (Kg/m2), the researcher takes a SRS of children from schools where the program is employed and a SRS from schools that do not employ the program and compares the results. Assume the following table represents the SRSs of students and their BMIs. Student intervention group BMI (kg/m2) Student control group BMI (kg/m2) A 18.6 A 21.6 B 18.2 B 18.9 C 19.5 C 19.4 D 18.9 D 22.6 E 24.1 F 23.6 A) Assuming that all the necessary conditions are met (normality, independence, etc.) carry out the appropriate statistical test to determine if the new exercise program is effective. Use an alpha level of 0.05. Do not assume equal variances.B) Construct a 95% confidence interval about your estimate for the average difference in BMI between the groups.A recent poll found that 664 out of 1026 randomly selected people in a particular country felt that colleges and universities with big sports programs placed too much emphasis on athletics over academics. Assuming the conditions for the CLT are met, use the accompanying Minitab output to complete parts a and b below. N Event Sample p 95% CI for p 1026 664 0.647173 (0.617934, 0.676413) Question content area bottom b. Suppose a sports blogger wrote an article claiming that a majority of adults from this country believe that colleges and universities with big sports programs place too much emphasis on athletics over academics. Does this confidence interval support the blogger's claim? Explain your reasoning. A. No, it is not a plausible claim because the confidence interval contains 50%. B. No, it is not a plausible claim because the confidence interval does not contain only values above 50%. C. Yes, it is a…