a) Please choose the suitable control charts to test whether or not the process is in control. b) A new sample results in the following slab weights: 81.0, 81.0, 80.8, 80.6, and 80.5. Judge whether or not the process is in control based on the data (including new sample data). c) Based on the data in part b), the specification for the concrete slabs is 78kg to 81kg, is √n the specification being met? Using the formulation = A₂R (n is sample size and A2 refers to tables in Week 8 slide) to estimate the standard deviation from average range.
a) Please choose the suitable control charts to test whether or not the process is in control. b) A new sample results in the following slab weights: 81.0, 81.0, 80.8, 80.6, and 80.5. Judge whether or not the process is in control based on the data (including new sample data). c) Based on the data in part b), the specification for the concrete slabs is 78kg to 81kg, is √n the specification being met? Using the formulation = A₂R (n is sample size and A2 refers to tables in Week 8 slide) to estimate the standard deviation from average range.

MATLAB: An Introduction with Applications
6th Edition
ISBN:9781119256830
Author:Amos Gilat
Publisher:Amos Gilat
Chapter1: Starting With Matlab
Section: Chapter Questions
Problem 1P

Related questions
Question
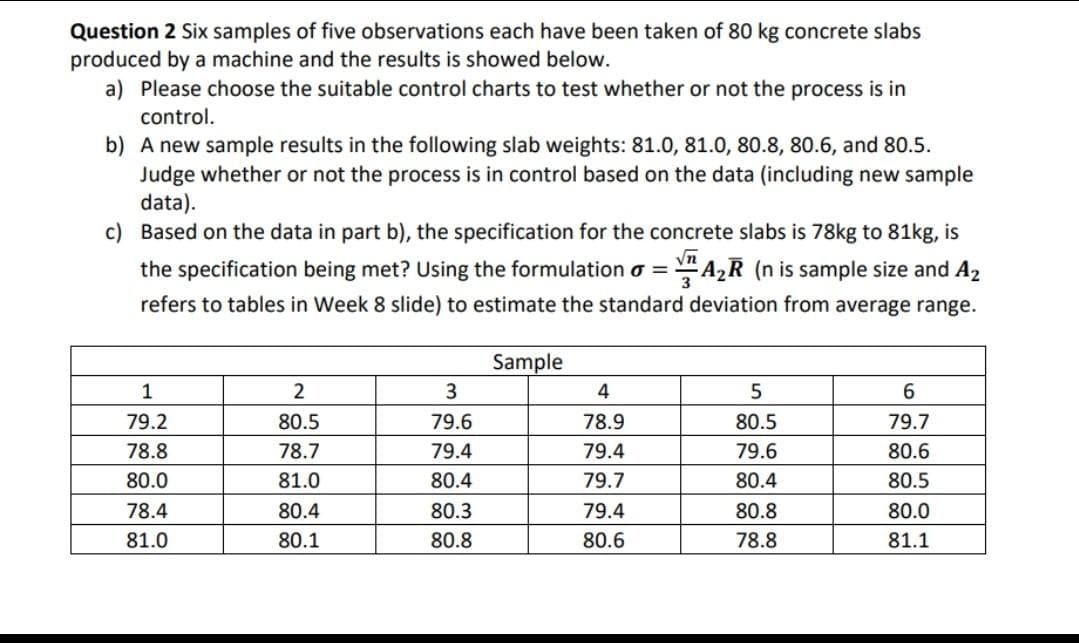
Transcribed Image Text:Question 2 Six samples of five observations each have been taken of 80 kg concrete slabs
produced by a machine and the results is showed below.
a) Please choose the suitable control charts to test whether or not the process is in
control.
b) A new sample results in the following slab weights: 81.0, 81.0, 80.8, 80.6, and 80.5.
Judge whether or not the process is in control based on the data (including new sample
data).
c) Based on the data in part b), the specification for the concrete slabs is 78kg to 81kg, is
the specification being met? Using the formulation o=A₂R (n is sample size and A2
refers to tables in Week 8 slide) to estimate the standard deviation from average range.
1
79.2
78.8
80.0
78.4
81.0
2
80.5
78.7
81.0
80.4
80.1
3
79.6
79.4
80.4
80.3
80.8
Sample
4
78.9
79.4
79.7
79.4
80.6
5
80.5
79.6
80.4
80.8
78.8
6
79.7
80.6
80.5
80.0
81.1
Expert Solution
This question has been solved!
Explore an expertly crafted, step-by-step solution for a thorough understanding of key concepts.

Step by step
Solved in 3 steps with 3 images

Recommended textbooks for you
MATLAB: An Introduction with Applications
Statistics
ISBN:
9781119256830
Author:
Amos Gilat
Publisher:
John Wiley & Sons Inc

Probability and Statistics for Engineering and th…
Statistics
ISBN:
9781305251809
Author:
Jay L. Devore
Publisher:
Cengage Learning

Statistics for The Behavioral Sciences (MindTap C…
Statistics
ISBN:
9781305504912
Author:
Frederick J Gravetter, Larry B. Wallnau
Publisher:
Cengage Learning
MATLAB: An Introduction with Applications
Statistics
ISBN:
9781119256830
Author:
Amos Gilat
Publisher:
John Wiley & Sons Inc
Probability and Statistics for Engineering and th…
Statistics
ISBN:
9781305251809
Author:
Jay L. Devore
Publisher:
Cengage Learning
Statistics for The Behavioral Sciences (MindTap C…
Statistics
ISBN:
9781305504912
Author:
Frederick J Gravetter, Larry B. Wallnau
Publisher:
Cengage Learning

Elementary Statistics: Picturing the World (7th E…
Statistics
ISBN:
9780134683416
Author:
Ron Larson, Betsy Farber
Publisher:
PEARSON

The Basic Practice of Statistics
Statistics
ISBN:
9781319042578
Author:
David S. Moore, William I. Notz, Michael A. Fligner
Publisher:
W. H. Freeman

Introduction to the Practice of Statistics
Statistics
ISBN:
9781319013387
Author:
David S. Moore, George P. McCabe, Bruce A. Craig
Publisher:
W. H. Freeman