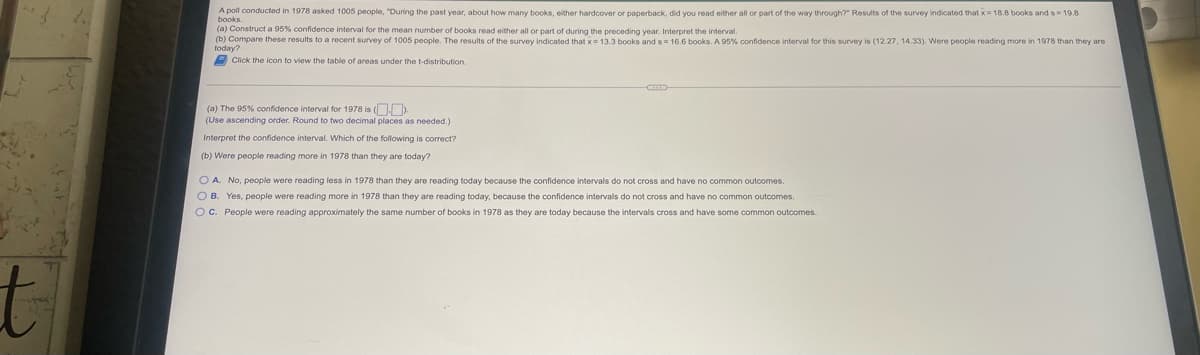
A pol conducted in 1978 asked 1005 people, "During the past year, about how many books, either hardcover or paperback, did you read either all or part of the way through?" Results of the survey indicated that x 18.8 books and s= 19.8 books (a) Construct a 95% confidence interval for the mean number of books read either all or part of during the preceding year. Interpret the interval. (b) Compare these results to a recent survey of 1005 people. The results of the survey indicated that x= 13.3 books and s 16.6 books. A 95% confidence interval for this survey is (12.27, 14.33). Were people reading more in 1978 than they are today? Click the icon to view the table of areas under the t-distribution (a) The 95% confidence interval for 1978 is (OD (Use ascending order. Round to two decimal places as needed.) Interpret the confidence interval. Which of the following is correct? (b) Were people reading more in 1978 than they are today? O A. No, people were reading less in 1978 than they are reading today because the confidence intervals do not cross and have no common outcomes. O B. Yes, people were reading more in 1978 than they are reading today, because the confidence intervals do not cross and have no common outcomes. OC. People were reading approximately the same number of books in 1978 as they are today because the intervals cross and have some common outcomes.
A pol conducted in 1978 asked 1005 people, "During the past year, about how many books, either hardcover or paperback, did you read either all or part of the way through?" Results of the survey indicated that x 18.8 books and s= 19.8 books (a) Construct a 95% confidence interval for the mean number of books read either all or part of during the preceding year. Interpret the interval. (b) Compare these results to a recent survey of 1005 people. The results of the survey indicated that x= 13.3 books and s 16.6 books. A 95% confidence interval for this survey is (12.27, 14.33). Were people reading more in 1978 than they are today? Click the icon to view the table of areas under the t-distribution (a) The 95% confidence interval for 1978 is (OD (Use ascending order. Round to two decimal places as needed.) Interpret the confidence interval. Which of the following is correct? (b) Were people reading more in 1978 than they are today? O A. No, people were reading less in 1978 than they are reading today because the confidence intervals do not cross and have no common outcomes. O B. Yes, people were reading more in 1978 than they are reading today, because the confidence intervals do not cross and have no common outcomes. OC. People were reading approximately the same number of books in 1978 as they are today because the intervals cross and have some common outcomes.

MATLAB: An Introduction with Applications
6th Edition
ISBN:9781119256830
Author:Amos Gilat
Publisher:Amos Gilat
Chapter1: Starting With Matlab
Section: Chapter Questions
Problem 1P

Related questions
Question
Help 17
Transcribed Image Text:A poll conducted in 1978 asked 1005 people, "During the past year, about how many books, either hardcover or paperback, did you read either all or part of the way through?" Results of the survey indicated that x= 18.8 books and s= 19.8
books.
(a) Construt a 95% confidence interval for the mean number of books read either all or part of during the
(b) Compare these results to a recent survey of 1005 people. The results of the survey indicated that x= 13.3 books and s= 16.6 books. A 95% confidence interval for this survey is (12.27, 14.33). Were people reading more in 1978 than they
one preceding year. Interpret the interval.
today?
A Click the icon to view the table of areas under the t-distribution.
(a) The 95% confidence interval for 1978 is ( ).
(Use ascending order. Round to two decimal places as needed.)
Interpret the confidence interval. Which of the following is correct?
(b) Were people reading more in 1978 than they are today?
O A. No, people were reading less in 1978 than they are reading today because the confidence intervals do not cross and have no common outcomes.
O B. Yes, people were reading more in 1978 than they are reading today, because the confidence intervals do not cross and have no common outcomes.
OC. People were reading approximately the same number of books in 1978 as they are today because the intervals cross and have some common outcomes.
Transcribed Image Text:(a) Construct a 95% confidence interval
(b) Compare these results to a recent su
today?
that x 18.8 books and s 19.8
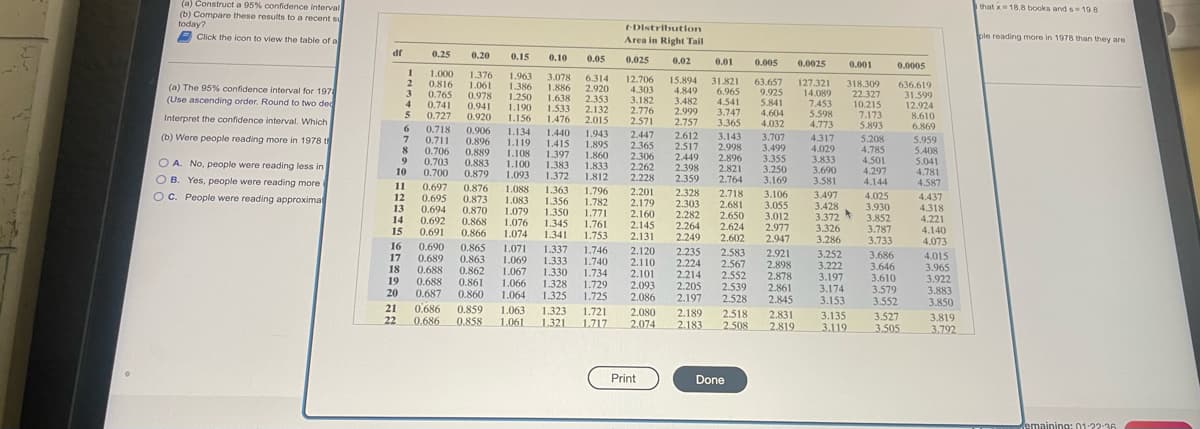
E-Distributlon
Click the icon to view the table of a
Area in Right Tail
ple reading more in 1978 than they are
df
0.25
0.20
0.15
0.10
0.05
0.025
0.02
0.01
0.005
0.0025
0.001
0.0005
1.000
1.376
1.061
0.978
0.941
1.963
1.386
1.250
3.078
1.886
1.638
1.533
6.314
2.920
12.706
4.303
15.894
4.849
31.821
6.965
4.541
63.657
9.925
5.841
2
0.816
127.321
318.309
22.327
10.215
7.173
5.893
636.619
31.599
12.924
(a) The 95% confidence interval for 197
(Use ascending order. Round to two dec
14.089
7453
5.598
4.773
3
0.765
2.353
2.132
2.015
3.182
2.776
3.482
2.999
2.757
4
0.741
0.727
1.190
3.747
3.365
4.604
4.032
8.610
6.869
Interpret the confidence interval. Which
0.920
1.156
1.476
2.571
6
0.718 0.906
1.440
1.415
1.108 1.397
1.383
1.372
1.134
1.943
1.895
1.860
1.833
1.812
2.447
2.612
3.143
2.998
2.896
2.821
(b) Were people reading more in 1978 t
3.707
3.499
3.355
3.250
3.169
4.317
4.029
3.833
3.690
3.581
7
0.711
5.208
5.959
5408
0.896
1.119
2.365
2.517
2.449
2.398
4.785
4.501
4.297
4.144
0.706
0.889
0.883
0.879
2.306
2.262
2.228
9
O A. No, people were reading less in
0.703
0.700
1.100
1.093
5.041
4.781
10
O B. Yes, people were reading more
OC. People were reading approxima
2.359
2.764
11
4.587
0.697
0.695
0.876
0.873
0.870
0.868
0.866
1.363
1.356
1.350
1.345
1.074 1.341 1.753
1.088
1.083
1.079
1.796
1.782
1.771
1.761
2.201
2.179
2.328
2.303
2.282
2.264
2.249
2.718
3.106
3.055
3.012
2.977
2.947
3.497
3.428
3.372
3.326
3.286
4.025
3.930
3.852
3.787
3.733
4.437
4.318
4.221
4.140
4.073
12
2.681
2.650
2.624
13
0.694
0.692
0.691
2.160
2.145
2.131
14
1.076
15
2.602
16
0.690
0.689
0.688
0.688
0.687
0.865
0.863
0.862
0.861
0.860
1.071 1.337
1.069 1.333
1.067 1.330
1.066
1.064
1.746
1.740
1.734
1.729
1.725
2.120
2.110
2.101
2.093
2.086
2.235
2.224
2.214
2.205
2.197
2.583
2.567
2.552
2.539
2.528
2.921
2.898
2.878
2.861
2.845
3.252
3.222
3.197
3.174
3.153
3.686
3.646
3.610
3.579
3.552
4.015
3.965
3.922
3.883
3.850
17
18
19
20
1.328
1.325
21
22
0.686
0.686
0.859
1.063
1.323
1.321
1.721
1.717
2.080
2.189
2.518
2.508
2.831
2.819
3.135
3.119
3.527
3.505
3.819
0.858
1.061
2.074
2.183
3.792
Print
Done
emaining: 01:22:36
Expert Solution
This question has been solved!
Explore an expertly crafted, step-by-step solution for a thorough understanding of key concepts.

This is a popular solution!

Trending now
This is a popular solution!

Step by step
Solved in 3 steps

Recommended textbooks for you
MATLAB: An Introduction with Applications
Statistics
ISBN:
9781119256830
Author:
Amos Gilat
Publisher:
John Wiley & Sons Inc

Probability and Statistics for Engineering and th…
Statistics
ISBN:
9781305251809
Author:
Jay L. Devore
Publisher:
Cengage Learning

Statistics for The Behavioral Sciences (MindTap C…
Statistics
ISBN:
9781305504912
Author:
Frederick J Gravetter, Larry B. Wallnau
Publisher:
Cengage Learning
MATLAB: An Introduction with Applications
Statistics
ISBN:
9781119256830
Author:
Amos Gilat
Publisher:
John Wiley & Sons Inc
Probability and Statistics for Engineering and th…
Statistics
ISBN:
9781305251809
Author:
Jay L. Devore
Publisher:
Cengage Learning
Statistics for The Behavioral Sciences (MindTap C…
Statistics
ISBN:
9781305504912
Author:
Frederick J Gravetter, Larry B. Wallnau
Publisher:
Cengage Learning

Elementary Statistics: Picturing the World (7th E…
Statistics
ISBN:
9780134683416
Author:
Ron Larson, Betsy Farber
Publisher:
PEARSON

The Basic Practice of Statistics
Statistics
ISBN:
9781319042578
Author:
David S. Moore, William I. Notz, Michael A. Fligner
Publisher:
W. H. Freeman

Introduction to the Practice of Statistics
Statistics
ISBN:
9781319013387
Author:
David S. Moore, George P. McCabe, Bruce A. Craig
Publisher:
W. H. Freeman