A popular uprising that started on January 25, 2011 in Egypt led to the 2011 Egyptian Revolution. Polls show that about 69% of American adults followed the news about the political crisis and demonstrations in Egypt closely during the first couple weeks following the start of the uprising. Among a random sample of 30 high school students, it was found that only 17 of them followed the news about Egypt closely during this time. (Source: Gallup Politics, Americans' Views of Egypt Sharply More Negative, data collected February 2-5, 2011).
A popular uprising that started on January 25, 2011 in Egypt led to the 2011 Egyptian Revolution. Polls show that about 69% of American adults followed the news about the political crisis and demonstrations in Egypt closely during the first couple weeks following the start of the uprising. Among a random sample of 30 high school students, it was found that only 17 of them followed the news about Egypt closely during this time. (Source: Gallup Politics, Americans' Views of Egypt Sharply More Negative, data collected February 2-5, 2011).

Glencoe Algebra 1, Student Edition, 9780079039897, 0079039898, 2018
18th Edition
ISBN:9780079039897
Author:Carter
Publisher:Carter
Chapter10: Statistics
Section10.6: Summarizing Categorical Data
Problem 10CYU

Related questions
Question
plz explain the answers for this practice quiz

Transcribed Image Text:The Egyptian Revolution
A popular uprising that started on January 25, 2011 in Egypt led to the 2011 Egyptian Revolution. Polls show that about 69% of American adults
followed the news about the political crisis and demonstrations in Egypt closely during the first couple weeks following the start of the uprising. Among
a random sample of 30 high school students, it was found that only 17 of them followed the news about Egypt closely during this time. (Source: Gallup
Politics, Americans' Views of Egypt Sharply More Negative, data collected February 2-5, 2011).
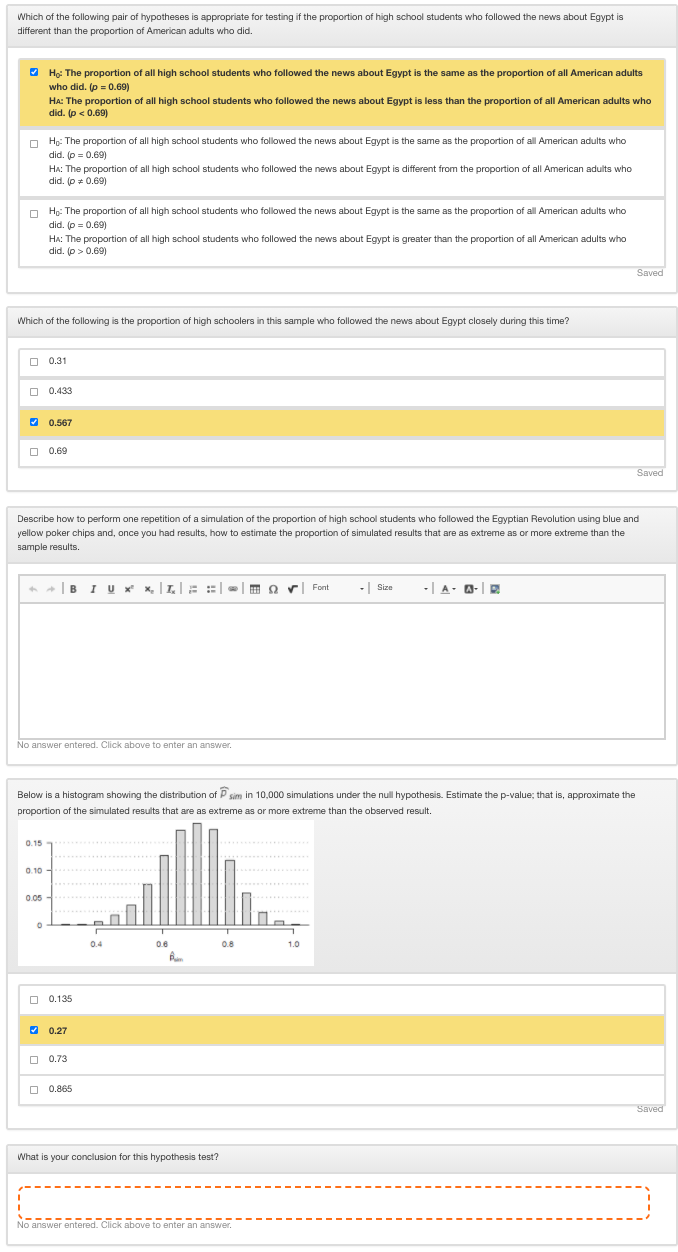
Transcribed Image Text:Which of the following pair of hypotheses is appropriate for testing if the proportion of high school students who followed the news about Egypt is
different than the proportion of American adults who did.
- Họ: The proportion of all high school students who followed the news about Egypt is the same as the proportion of all American adults
who did. (p = 0.69)
HA: The proportion of all high school students who followed the news about Egypt is less than the proportion of all American adults who
did. (p < 0.69)
O Ho: The proportion of all high school students who followed the news about Egypt is the same as the proportion of all American adults who
did. (o = 0.69)
HA: The proportion of all high school students who followed the news about Egypt is different from the proportion of all American adults who
did. (p + 0.69)
O Hp: The proportion of all high school students who followed the news about Egypt is the same as the proportion of all American adults who
did. (p = 0.69)
HA: The proportion of all high school students who followed the news about Egypt is greater than the proportion of all American adults who
did. (p> 0.69)
Saved
Which of the following is the proportion of high schoolers in this sample who followed the news about Egypt closely during this time?
O 0.31
O 0.433
O 0.567
O 0.69
Saved
Describe how to perform one repetition of a simulation of the proportion of high school students who followed the Egyptian Revolution using blue and
yellow poker chips and, once you had results, how to estimate the proportion of simulated results that are as extreme as or more extreme than the
sample results.
*+ |BI U x x, |1,| : ::|| E Qr
- Size
-| A- A- D
Font
No answer entered. Click above to enter an answer.
Below is a histogram showing the distribution of P sim in 10,000 simulations under the null hypothesis. Estimate the p-value; that is, approximate the
proportion of the simulated results that are as extreme as or more extreme than the observed result.
0.15
0.10
0.05
0.4
0.6
0.8
1.0
O 0.135
- 0.27
O 0.73
O 0.865
Saved
What is your conclusion for this hypothesis test?
---- ---
No answer entered. Click above to enter an answer.
O D O O
Expert Solution
This question has been solved!
Explore an expertly crafted, step-by-step solution for a thorough understanding of key concepts.

This is a popular solution!

Trending now
This is a popular solution!

Step by step
Solved in 2 steps with 1 images

Recommended textbooks for you
Glencoe Algebra 1, Student Edition, 9780079039897…
Algebra
ISBN:
9780079039897
Author:
Carter
Publisher:
McGraw Hill

Holt Mcdougal Larson Pre-algebra: Student Edition…
Algebra
ISBN:
9780547587776
Author:
HOLT MCDOUGAL
Publisher:
HOLT MCDOUGAL

Glencoe Algebra 1, Student Edition, 9780079039897…
Algebra
ISBN:
9780079039897
Author:
Carter
Publisher:
McGraw Hill
Holt Mcdougal Larson Pre-algebra: Student Edition…
Algebra
ISBN:
9780547587776
Author:
HOLT MCDOUGAL
Publisher:
HOLT MCDOUGAL

College Algebra (MindTap Course List)
Algebra
ISBN:
9781305652231
Author:
R. David Gustafson, Jeff Hughes
Publisher:
Cengage Learning