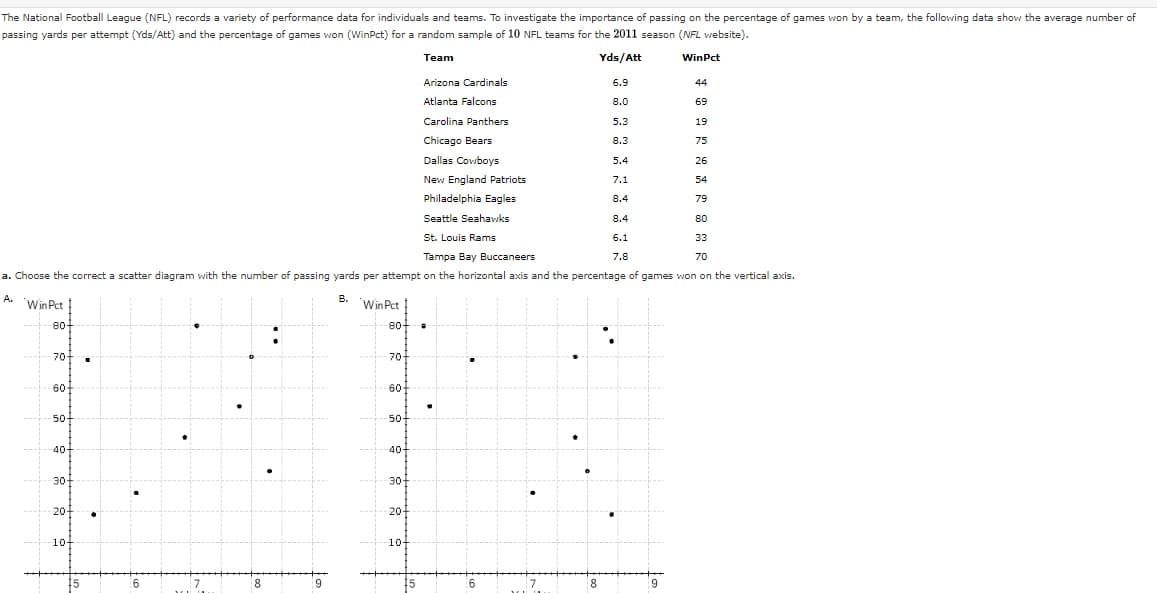
The National Football League (NFL) records a variety of performance data for individuals and teams. To investigate the importance of passing on the percentage of games won by a team, the following data show the average number of passing yards per attempt (Yds/Att) and the percentage of games won (WinPct) for a random sample of 10 NFL teams for the 2011 season (NFL website). Team Yds/Att WinPct Arizona Cardinals 6.9 44 Atlanta Falcons 8.0 69 Carolina Panthers 5.3 19 Chicago Bears 8.3 75 Dallas Cowboys 5.4 26 New England Patriots 7.1 54 Philadelphia Eagles 8.4 79 Seattle Seahawks 8.4 80 St. Louis Rams 6.1 33 Tampa Bay Buccaneers 7.8 70 a. Choose the correct a scatter diagram with the number of passing yards per attempt on the horizontal axis and the percentage of games won on the vertical axis. B. A. Win Pct ! Win Pct! 80- 80- 70- 70- 60 60 50 50- 40 40- 30- 30- 20 20- 10- 10- 15 69 15 17 8. 9
The National Football League (NFL) records a variety of performance data for individuals and teams. To investigate the importance of passing on the percentage of games won by a team, the following data show the average number of passing yards per attempt (Yds/Att) and the percentage of games won (WinPct) for a random sample of 10 NFL teams for the 2011 season (NFL website). Team Yds/Att WinPct Arizona Cardinals 6.9 44 Atlanta Falcons 8.0 69 Carolina Panthers 5.3 19 Chicago Bears 8.3 75 Dallas Cowboys 5.4 26 New England Patriots 7.1 54 Philadelphia Eagles 8.4 79 Seattle Seahawks 8.4 80 St. Louis Rams 6.1 33 Tampa Bay Buccaneers 7.8 70 a. Choose the correct a scatter diagram with the number of passing yards per attempt on the horizontal axis and the percentage of games won on the vertical axis. B. A. Win Pct ! Win Pct! 80- 80- 70- 70- 60 60 50 50- 40 40- 30- 30- 20 20- 10- 10- 15 69 15 17 8. 9

Glencoe Algebra 1, Student Edition, 9780079039897, 0079039898, 2018
18th Edition
ISBN:9780079039897
Author:Carter
Publisher:Carter
Chapter10: Statistics
Section10.6: Summarizing Categorical Data
Problem 10CYU

Related questions
Question
Transcribed Image Text:The National Football League (NFL) records a variety of performance data for individuals and teams. To investigate the importance of passing on the percentage of games won by a team, the following data show the average number of
passing yards per attempt (Yds/Att) and the percentage of games won (WinPct) for a random sample of 10 NFL teams for the 2011 season (NFL website).
Team
Yds/Att
WinPct
Arizona Cardinals
6.9
44
Atlanta Falcons
8.0
69
Carolina Panthers
5.3
19
Chicago Bears
8.3
75
Dallas Cowboys
5.4
26
New England Patriots
7.1
54
Philadelphia Eagles
8.4
79
Seattle Seahawks
8.4
80
St. Louis Rams
6.1
33
Tampa Bay Buccaneers
7.8
70
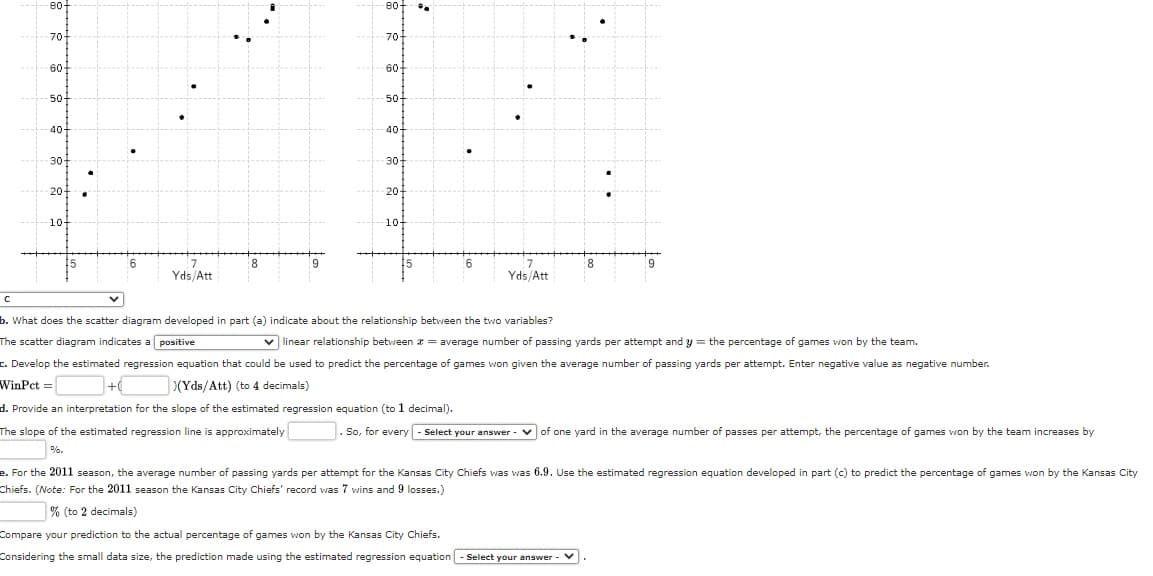
a. Choose the correct a scatter diagram with the number of passing yards per attempt on the horizontal axis and the percentage of games won on the vertical axis.
A.
в.
Win Pct |
Win Pct
80-
80-
:
70-
70-
60-
60
50
50-
40-
40-
30-
30
20
20-
10
10-
8
8.
Transcribed Image Text:80
80
70-
70
60-
60
50
50-
40-
40-
30
30-
20-
20-
10-
10-
8.
Yds/Att
Yds/Att
b. What does the scatter diagram developed in part (a) indicate about the relationship between the two variables?
The scatter diagram indicates a positive
v linear relationship between æ = average number of passing yards per attempt and y = the percentage of games won by the team.
c. Develop the estimated regression equation that could be used to predict the percentage of games won given the average number of passing yards per attempt. Enter negative value as negative number.
WinPet =
)(Yds/Att) (to 4 decimals)
d. Provide an interpretation for the slope of the estimated regression equation (to 1 decimal).
The slope of the estimated regression line is approximately
.So, for every - Select your answer - vof one yard in the average number of passes per attempt, the percentage of games won by the team increases by
e. For the 2011 season, the average number of passing yards per attempt for the Kansas City Chiefs was was 6.9. Use the estimated regression equation developed in part (c) to predict the percentage of games won by the Kansas City
Chiefs. (Note: For the 2011 season the Kansas City Chiefs' record was 7 wins and 9 losses.)
% (to 2 decimals)
Compare your prediction to the actual percentage of games won by the Kansas City Chiefs.
Considering the small data size, the prediction made using the estimated regression equation
Select your answer
Expert Solution
This question has been solved!
Explore an expertly crafted, step-by-step solution for a thorough understanding of key concepts.

This is a popular solution!

Trending now
This is a popular solution!

Step by step
Solved in 4 steps with 2 images

Recommended textbooks for you
Glencoe Algebra 1, Student Edition, 9780079039897…
Algebra
ISBN:
9780079039897
Author:
Carter
Publisher:
McGraw Hill

Holt Mcdougal Larson Pre-algebra: Student Edition…
Algebra
ISBN:
9780547587776
Author:
HOLT MCDOUGAL
Publisher:
HOLT MCDOUGAL
Glencoe Algebra 1, Student Edition, 9780079039897…
Algebra
ISBN:
9780079039897
Author:
Carter
Publisher:
McGraw Hill
Holt Mcdougal Larson Pre-algebra: Student Edition…
Algebra
ISBN:
9780547587776
Author:
HOLT MCDOUGAL
Publisher:
HOLT MCDOUGAL