A process sampled 20 times with a sample of size 8 resulted in = 21.5 and R = 1.4. Compute the upper and lower control limits for the x chart for this process. (Round your answers to two decimal places.) UCL = LCL = Compute the upper and lower control limits for the R chart for this process. (Round your answers to two decimal places.)
A process sampled 20 times with a sample of size 8 resulted in = 21.5 and R = 1.4. Compute the upper and lower control limits for the x chart for this process. (Round your answers to two decimal places.) UCL = LCL = Compute the upper and lower control limits for the R chart for this process. (Round your answers to two decimal places.)

Holt Mcdougal Larson Pre-algebra: Student Edition 2012
1st Edition
ISBN:9780547587776
Author:HOLT MCDOUGAL
Publisher:HOLT MCDOUGAL
Chapter11: Data Analysis And Probability
Section: Chapter Questions
Problem 7CR

Related questions
Question
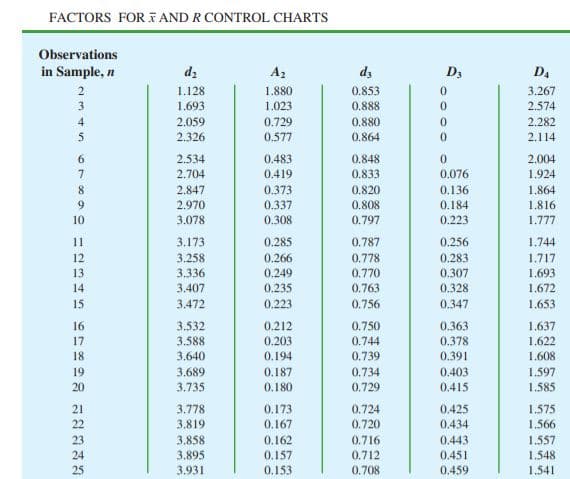
Transcribed Image Text:FACTORS FOR I AND R CONTROL CHARTS
Observations
in Sample, n
dz
A2
dz
D3
D4
2
1.128
1.880
0.853
3.267
3
1.693
1.023
0.888
2.574
4
2.059
0.729
0.880
2.282
5.
2.326
0.577
0.864
2.114
6.
7.
2.534
0.483
0.848
2.004
2.704
0.419
0.833
0.076
1.924
8.
2.847
0.373
0.820
0.136
1.864
2.970
0.337
0.808
0.184
1.816
10
3.078
0.308
0.797
0.223
1.777
11
3.173
0.285
0.787
0.256
1.744
12
13
3.258
3.336
3.407
0.266
0.249
0.235
0.778
0.770
0.763
0.283
1.717
0.307
1.693
1.672
1.653
14
0.328
15
3.472
0.223
0.756
0.347
3.532
0.212
0.750
0.744
0.739
0.363
0.378
0.391
16
1.637
17
18
3.588
0.203
1.622
3.640
0.194
1.608
19
20
3.689
3.735
0.187
0.734
0.403
1.597
0.180
0.729
0.415
1.585
21
22
3.778
3.819
1.575
1.566
0.173
0.724
0.425
0.434
0.167
0.720
23
24
25
3.858
3.895
3.931
0.162
0.157
0.153
0.716
0.712
1.557
1.548
0.443
0.451
0.708
0.459
1.541
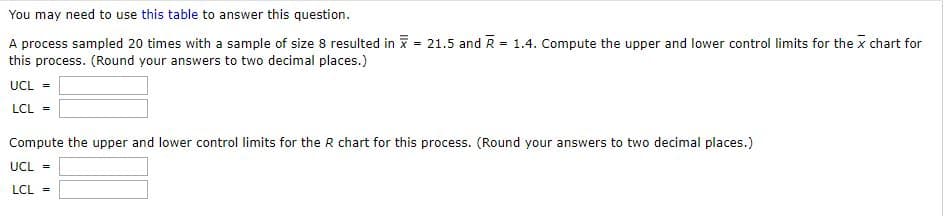
Transcribed Image Text:You may need to use this table to answer this question.
A process sampled 20 times with a sample of size 8 resulted in x = 21.5 and R = 1.4. Compute the upper and lower control limits for the x chart for
%3D
this process. (Round your answers to two decimal places.)
UCL =
LCL =
Compute the upper and lower control limits for the R chart for this process. (Round your answers to two decimal places.)
UCL =
LCL =
Expert Solution
This question has been solved!
Explore an expertly crafted, step-by-step solution for a thorough understanding of key concepts.

This is a popular solution!

Trending now
This is a popular solution!

Step by step
Solved in 2 steps with 1 images

Knowledge Booster


Learn more about
Need a deep-dive on the concept behind this application? Look no further. Learn more about this topic, statistics and related others by exploring similar questions and additional content below.Recommended textbooks for you
Holt Mcdougal Larson Pre-algebra: Student Edition…
Algebra
ISBN:
9780547587776
Author:
HOLT MCDOUGAL
Publisher:
HOLT MCDOUGAL

Glencoe Algebra 1, Student Edition, 9780079039897…
Algebra
ISBN:
9780079039897
Author:
Carter
Publisher:
McGraw Hill

College Algebra (MindTap Course List)
Algebra
ISBN:
9781305652231
Author:
R. David Gustafson, Jeff Hughes
Publisher:
Cengage Learning
Holt Mcdougal Larson Pre-algebra: Student Edition…
Algebra
ISBN:
9780547587776
Author:
HOLT MCDOUGAL
Publisher:
HOLT MCDOUGAL
Glencoe Algebra 1, Student Edition, 9780079039897…
Algebra
ISBN:
9780079039897
Author:
Carter
Publisher:
McGraw Hill
College Algebra (MindTap Course List)
Algebra
ISBN:
9781305652231
Author:
R. David Gustafson, Jeff Hughes
Publisher:
Cengage Learning