A professor in the psychology department would like to determine whether there has been a significant change in grading practices over the years. It is known that the overall grade distribution for the department in 1985 had 14% A's, 26% B's, 31% C's, 19% D's, and 10% F's. A sample of n = 200 psychology students from last semester produced the following grade distribution: A 32% 11% 14% 31% 12% Do the data indicate a significant change in the grade distribution? Test at the .05 level of significance. Use Chi-square.
A professor in the psychology department would like to determine whether there has been a significant change in grading practices over the years. It is known that the overall grade distribution for the department in 1985 had 14% A's, 26% B's, 31% C's, 19% D's, and 10% F's. A sample of n = 200 psychology students from last semester produced the following grade distribution: A 32% 11% 14% 31% 12% Do the data indicate a significant change in the grade distribution? Test at the .05 level of significance. Use Chi-square.

Holt Mcdougal Larson Pre-algebra: Student Edition 2012
1st Edition
ISBN:9780547587776
Author:HOLT MCDOUGAL
Publisher:HOLT MCDOUGAL
Chapter11: Data Analysis And Probability
Section: Chapter Questions
Problem 8CR

Related questions
Question
Do the data indicate a significant change in grade distribution? Test at the .05 level of significance. Use Chi-square
Transcribed Image Text:12% O
Mon 9:32 PM
Bookmarks
People Tab
Window
Help
Chrome
File
Edit
View
History
B Take Test: Week # 12 assignm
S
A Not Secure bb.wpunj.edu webapps/assessment/take/launch.jsp?course assessment id%= 92221 1&course id= 129468 1&content id= 2567819 1&step=null
QUESTION 1
Formulas for Chi-square:
(fobserved Jerpected)
feepected
- theoretical frequency
x² = =
where fobserved – frequency that is observed in the experiment3;
feapected
Effect size for Chi-square (if you have 2x2 contingency table) :
Vi where x
is Chi – square calculated for the sample; N- number of observations
in the sample
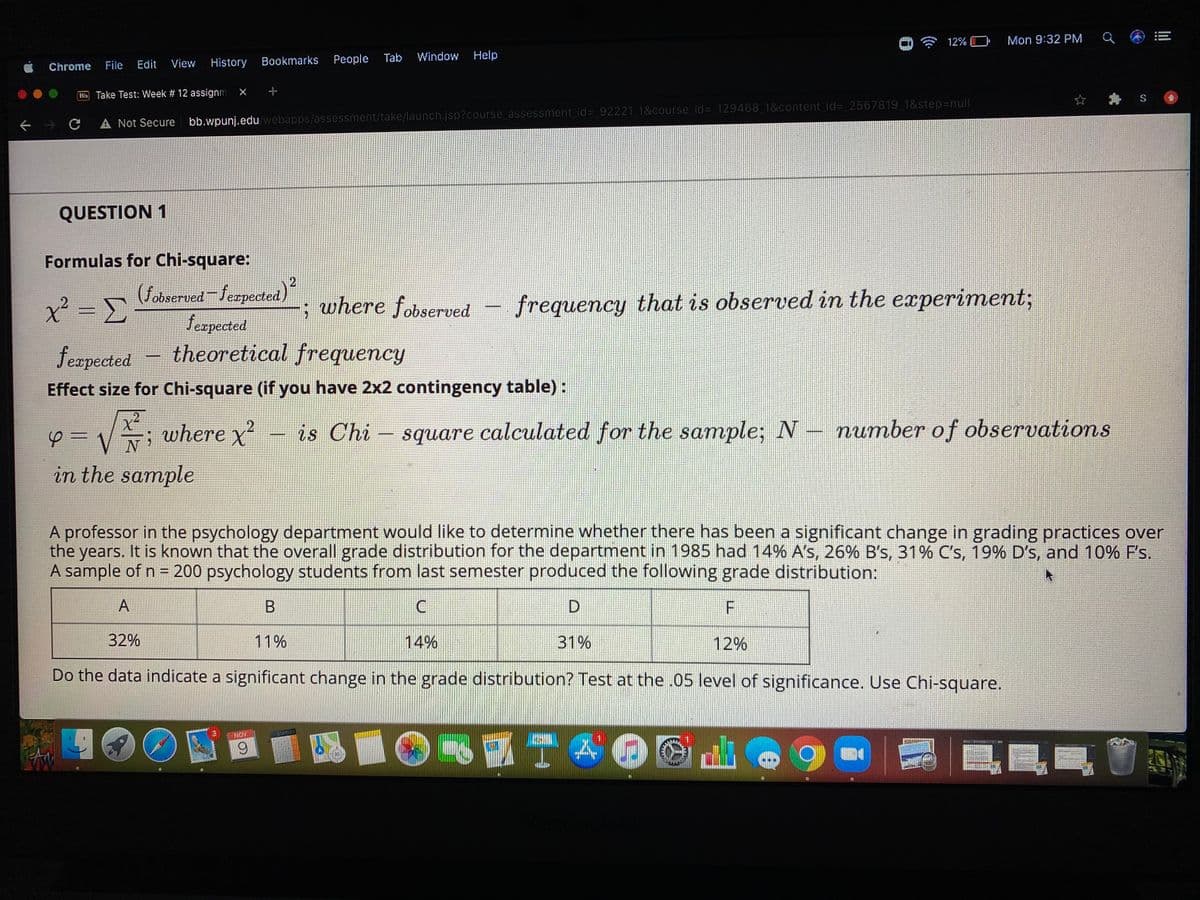
A professor in the psychology department would like to determine whether there has been a significant change in grading practices over
the
years. It is known that the overall grade distribution for the department in 1985 had 14% A's, 26% B's, 31% C's, 19% D's, and 10% F's.
A sample of n = 200 psychology students from last semester produced the following grade distribution:
%3D
A
D.
32%
11%
14%
31%
12%
Do the data indicate a significant change in the grade distribution? Test at the.05 level of significance. Use Chi-square.
3
NOV
Expert Solution
This question has been solved!
Explore an expertly crafted, step-by-step solution for a thorough understanding of key concepts.

This is a popular solution!

Trending now
This is a popular solution!

Step by step
Solved in 2 steps with 1 images

Knowledge Booster


Learn more about
Need a deep-dive on the concept behind this application? Look no further. Learn more about this topic, statistics and related others by exploring similar questions and additional content below.Recommended textbooks for you
Holt Mcdougal Larson Pre-algebra: Student Edition…
Algebra
ISBN:
9780547587776
Author:
HOLT MCDOUGAL
Publisher:
HOLT MCDOUGAL

Algebra & Trigonometry with Analytic Geometry
Algebra
ISBN:
9781133382119
Author:
Swokowski
Publisher:
Cengage
Holt Mcdougal Larson Pre-algebra: Student Edition…
Algebra
ISBN:
9780547587776
Author:
HOLT MCDOUGAL
Publisher:
HOLT MCDOUGAL
Algebra & Trigonometry with Analytic Geometry
Algebra
ISBN:
9781133382119
Author:
Swokowski
Publisher:
Cengage