A psychiatrist is wants to understand the effect of rationality on phobias.  The psychiatrist has maternal twin patients with Scoleciphobia.  In an experiment designed to induce anxiety, the psychiatrist randomly assigned one of the twins to look at real worms in a small glass tank and the other twin looks at pictures of worms.  The anxiety scores for the patients are below where a higher score indicates more anxiety.  What can be concluded with α = 0.10? real picture 3646415235562631454050 3853586858533833536342   A) critical value equals= test statistic equals= B) What is the CI?   C) Compute the corresponding effect size(s) and indicate magnitude(s) d= r2

MATLAB: An Introduction with Applications
6th Edition
ISBN:9781119256830
Author:Amos Gilat
Publisher:Amos Gilat
Chapter1: Starting With Matlab
Section: Chapter Questions
Problem 1P
icon
Related questions
Topic Video
Question

A psychiatrist is wants to understand the effect of rationality on phobias.  The psychiatrist has maternal twin patients with Scoleciphobia.  In an experiment designed to induce anxiety, the psychiatrist randomly assigned one of the twins to look at real worms in a small glass tank and the other twin looks at pictures of worms.  The anxiety scores for the patients are below where a higher score indicates more anxiety.  What can be concluded with α = 0.10?

real picture
36
46
41
52
35
56
26
31
45
40
50
38
53
58
68
58
53
38
33
53
63
42


A)

critical value equals=

test statistic equals=

B)

What is the CI?


C) Compute the corresponding effect size(s) and indicate magnitude(s)

d=

r2

Expert Solution
Step 1

A)

The degrees of freedom is,

Statistics homework question answer, step 1, image 1

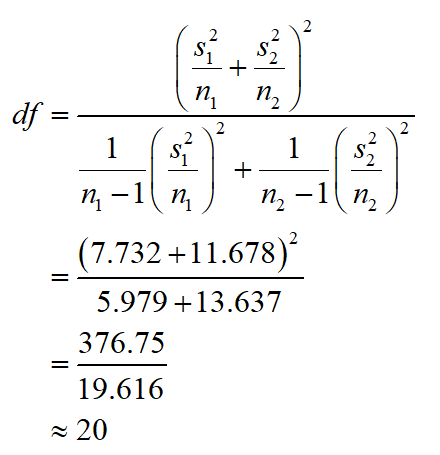
Thus, the degrees of freedom is 20.

Critical value:

The critical value is calculated by using the level of significance and degrees of freedom,

Statistics homework question answer, step 1, image 2

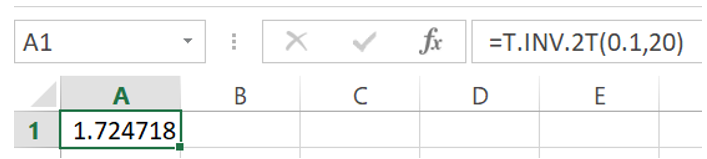
Thus, the critical value is ±1.725.

Test statistic:

Statistics homework question answer, step 1, image 3

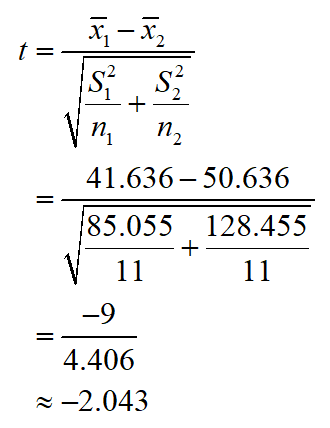
Thus, the test statistic is -2.043.


Step 2

B)

The standard error is calculated before constructing the confidence interval.

Statistics homework question answer, step 2, image 1

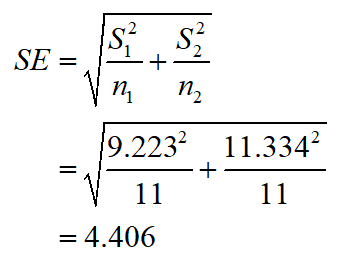
Thus, the standard error is 4.406.

Confidence interval is,

Statistics homework question answer, step 2, image 2

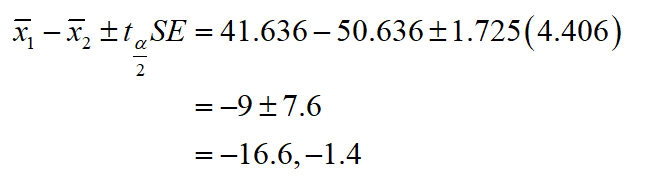
Thus, the 90% confidence interval is (-16.6, -1.4).

steps

Step by step

Solved in 3 steps with 7 images

Blurred answer
Knowledge Booster
Hypothesis Tests and Confidence Intervals for Means
Learn more about
Need a deep-dive on the concept behind this application? Look no further. Learn more about this topic, statistics and related others by exploring similar questions and additional content below.
Similar questions
  • SEE MORE QUESTIONS
Recommended textbooks for you
MATLAB: An Introduction with Applications
Statistics
ISBN:
9781119256830
Author:
Amos Gilat
Publisher:
John Wiley & Sons Inc
Probability and Statistics for Engineering and th…
Statistics
ISBN:
9781305251809
Author:
Jay L. Devore
Publisher:
Cengage Learning
Statistics for The Behavioral Sciences (MindTap C…
Statistics
ISBN:
9781305504912
Author:
Frederick J Gravetter, Larry B. Wallnau
Publisher:
Cengage Learning
Elementary Statistics: Picturing the World (7th E…
Statistics
ISBN:
9780134683416
Author:
Ron Larson, Betsy Farber
Publisher:
PEARSON
The Basic Practice of Statistics
Statistics
ISBN:
9781319042578
Author:
David S. Moore, William I. Notz, Michael A. Fligner
Publisher:
W. H. Freeman
Introduction to the Practice of Statistics
Statistics
ISBN:
9781319013387
Author:
David S. Moore, George P. McCabe, Bruce A. Craig
Publisher:
W. H. Freeman