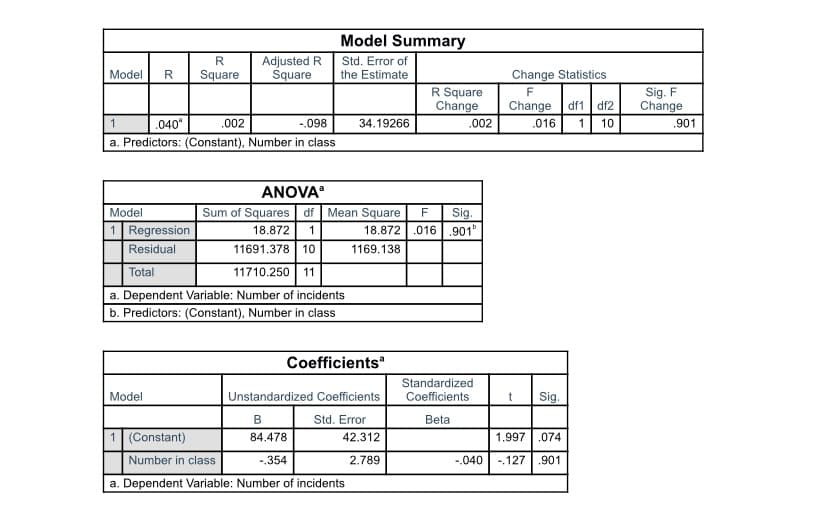
A psychologist read the results of the study and wanted to replicate the methodology in her school. The data are below. Number in class Number of incidents 10 120 18 090 20 118 19 060 20 081 12 064 15 026 14 038 12 050 11 080 15 100 11 124 12.) The linear equation for the above data is a) Ŷ =84.478X + (-.354) b) Ŷ =-.354X + 84.478 c) Ŷ = -.040X + 84.478 d) Ŷ =1.997X + (-.354) How many incidents would be expected if there were 17 people in the class ?_________________ What is the coefficent of determination?


Inverse Normal Distribution
The method used for finding the corresponding z-critical value in a normal distribution using the known probability is said to be an inverse normal distribution. The inverse normal distribution is a continuous probability distribution with a family of two parameters.
Mean, Median, Mode
It is a descriptive summary of a data set. It can be defined by using some of the measures. The central tendencies do not provide information regarding individual data from the dataset. However, they give a summary of the data set. The central tendency or measure of central tendency is a central or typical value for a probability distribution.
Z-Scores
A z-score is a unit of measurement used in statistics to describe the position of a raw score in terms of its distance from the mean, measured with reference to standard deviation from the mean. Z-scores are useful in statistics because they allow comparison between two scores that belong to different normal distributions.
A psychologist read the results of the study and wanted to replicate the methodology in her school. The data are below.
Number in class Number of incidents
10 120
18 090
20 118
19 060
20 081
12 064
15 026
14 038
12 050
11 080
15 100
11 124
12.) The linear equation for the above data is
a) Ŷ =84.478X + (-.354)
b) Ŷ =-.354X + 84.478
c) Ŷ = -.040X + 84.478
d) Ŷ =1.997X + (-.354)
How many incidents would be expected if there were 17 people in the class ?_________________
What is the coefficent of determination?


Trending now
This is a popular solution!

Step by step
Solved in 3 steps with 2 images


