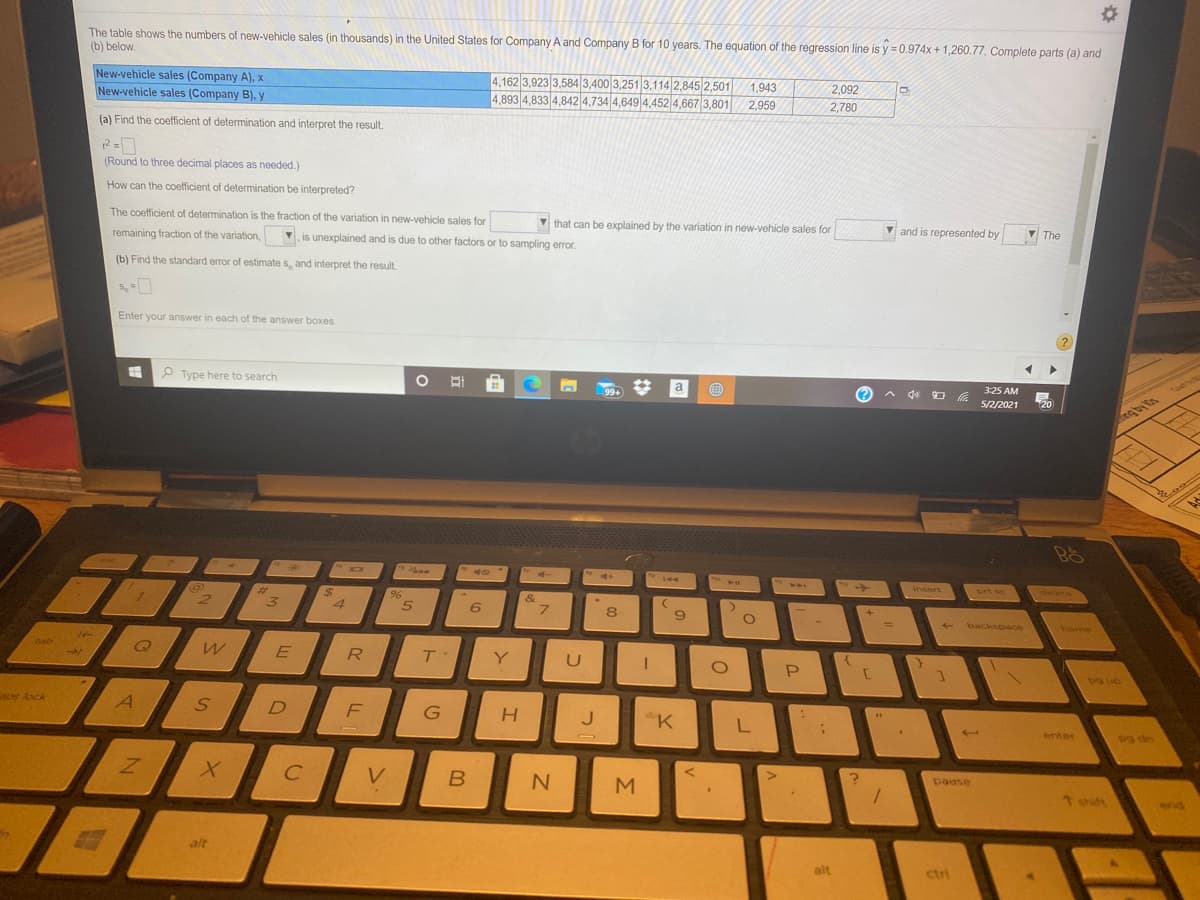
The table shows the numbers of new-vehicle sales (in thousands) in the United States for Company A and Company B for 10 years. The equation of the regression line is y 0.974x + 1,260.77. Complete parts (a) and (b) below. New-vehicle sales (Company A), x 4,162 3,923 3,584 3,400 3,251 3,114 2,845 2,501 1,943 2.092 New-vehicle sales (Company B), y 4,893 4,833 4,842 4,734 4,649 4,452 4,667 3,801 2,959 2,780 How can the coetticient of determination be interpreted? The coefficient of determination is the fraction of the variation in new-vehicle sales for V that can be explained by the variation in new-vehicle sales for Vand is represented by The remaining fraction of the variation, V, is unexplained and is due to other factors or to sampling error. (b) Find the standard error of estimate s, and interpret the result. (Round to three decimal places as needed.) How can the standard error of estimate be interpreted? The standard error of estimate of the new-vehicle sales for V for V of new-vehicle sales for v is about s Enter your answer in each of the answer boxes. 3:26 AM P Type here to search a (? 99+ 5/2/2021


Correlation
Correlation defines a relationship between two independent variables. It tells the degree to which variables move in relation to each other. When two sets of data are related to each other, there is a correlation between them.
Linear Correlation
A correlation is used to determine the relationships between numerical and categorical variables. In other words, it is an indicator of how things are connected to one another. The correlation analysis is the study of how variables are related.
Regression Analysis
Regression analysis is a statistical method in which it estimates the relationship between a dependent variable and one or more independent variable. In simple terms dependent variable is called as outcome variable and independent variable is called as predictors. Regression analysis is one of the methods to find the trends in data. The independent variable used in Regression analysis is named Predictor variable. It offers data of an associated dependent variable regarding a particular outcome.


Trending now
This is a popular solution!

Step by step
Solved in 4 steps


