A question of interest is whether increasing the amot levels for pre-diabetic adults and if so, in what fashion. A random sample of twenty pre-diabetic adults was obtained. The data below gives the amount of time spent exercising per week (in hours) and the person's blood glucose level (measured in mg/dL).
A question of interest is whether increasing the amot levels for pre-diabetic adults and if so, in what fashion. A random sample of twenty pre-diabetic adults was obtained. The data below gives the amount of time spent exercising per week (in hours) and the person's blood glucose level (measured in mg/dL).

Functions and Change: A Modeling Approach to College Algebra (MindTap Course List)
6th Edition
ISBN:9781337111348
Author:Bruce Crauder, Benny Evans, Alan Noell
Publisher:Bruce Crauder, Benny Evans, Alan Noell
Chapter5: A Survey Of Other Common Functions
Section5.3: Modeling Data With Power Functions
Problem 6E: Urban Travel Times Population of cities and driving times are related, as shown in the accompanying...

Related questions
Question
Problem 4.
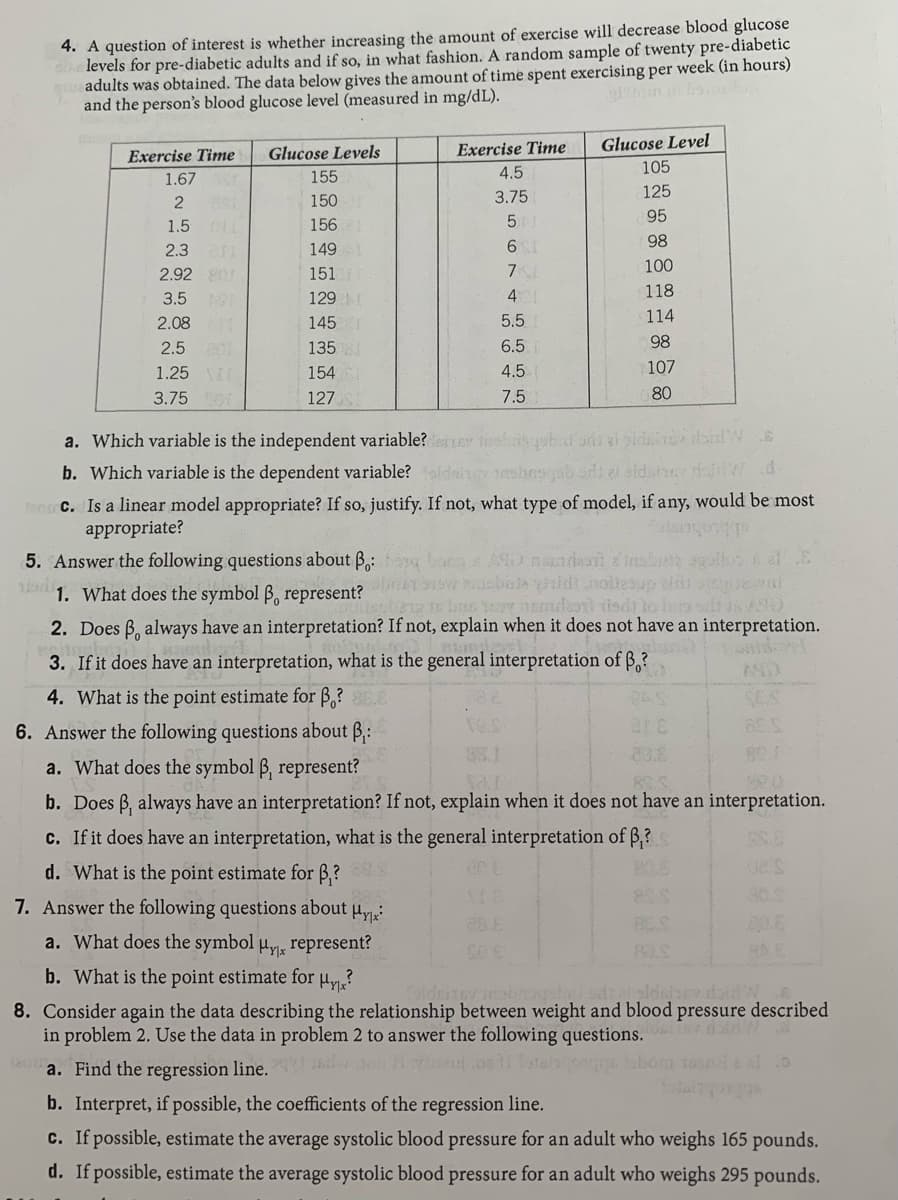
Transcribed Image Text:4. A question of interest is whether increasing the amount of exercise will decrease blood glucose
levels for pre-diabetic adults and if so, in what fashion. A random sample of twenty pre-diabetic
adults was obtained. The data below gives the amount of time spent exercising per week (in hours)
and the person's blood glucose level (measured in mg/dL).
Exercise Time
Glucose Level
Exercise Time
Glucose Levels
4.5
105
1.67
155
3.75
125
150
95
1.5 D
156
2.3
149
6.
98
100
2.92
151
3.5 S
4
118
129
2.08
145
5.5
114
2.5 01
135
6.5
98
1.25
154
4.5
107
3.75
127
7.5
80
a. Which variable is the independent variable?rLEY
b. Which variable is the dependent variable?ldsine nsbesgabadi e sidshedidWd.
c. Is a linear model appropriate? If so, justify. If not, what type of model, if any, would be most
appropriate?
bbtohus
5. Answer the following questions about B,:
1a1. What does the symbol B, represent?
meansic ruje dricaou ipr erade
2. Does B, always have an interpretation? If not, explain when it does not have an interpretation.
3. If it does have an interpretation, what is the general interpretation of ß,?
4. What is the point estimate for B,?
SCS
6. Answer the following questions about B,:
88.1
80.1
a. What does the symbol B, represent?
b. Does B, always have an interpretation? If not, explain when it does not have an interpretation.
c. If it does have an interpretation, what is the general interpretation of B,?
d. What is the point estimate for B,?
30.S
7. Answer the following questions about µy
a. What does the symbol uy, represent?
80S
8A E
b. What is the point estimate for µy?
sldnev.da
8. Consider again the data describing the relationship between weight and blood pressure described
in problem 2. Use the data in problem 2 to answer the following questions.
a. Find the regression line.Y on H ut os
b. Interpret, if possible, the coefficients of the regression line.
c. If possible, estimate the average systolic blood pressure for an adult who weighs 165 pounds.
d. If possible, estimate the average systolic blood pressure for an adult who weighs 295 pounds.
Expert Solution
This question has been solved!
Explore an expertly crafted, step-by-step solution for a thorough understanding of key concepts.

This is a popular solution!

Trending now
This is a popular solution!

Step by step
Solved in 3 steps with 4 images

Knowledge Booster


Learn more about
Need a deep-dive on the concept behind this application? Look no further. Learn more about this topic, statistics and related others by exploring similar questions and additional content below.Recommended textbooks for you
Functions and Change: A Modeling Approach to Coll…
Algebra
ISBN:
9781337111348
Author:
Bruce Crauder, Benny Evans, Alan Noell
Publisher:
Cengage Learning
Functions and Change: A Modeling Approach to Coll…
Algebra
ISBN:
9781337111348
Author:
Bruce Crauder, Benny Evans, Alan Noell
Publisher:
Cengage Learning