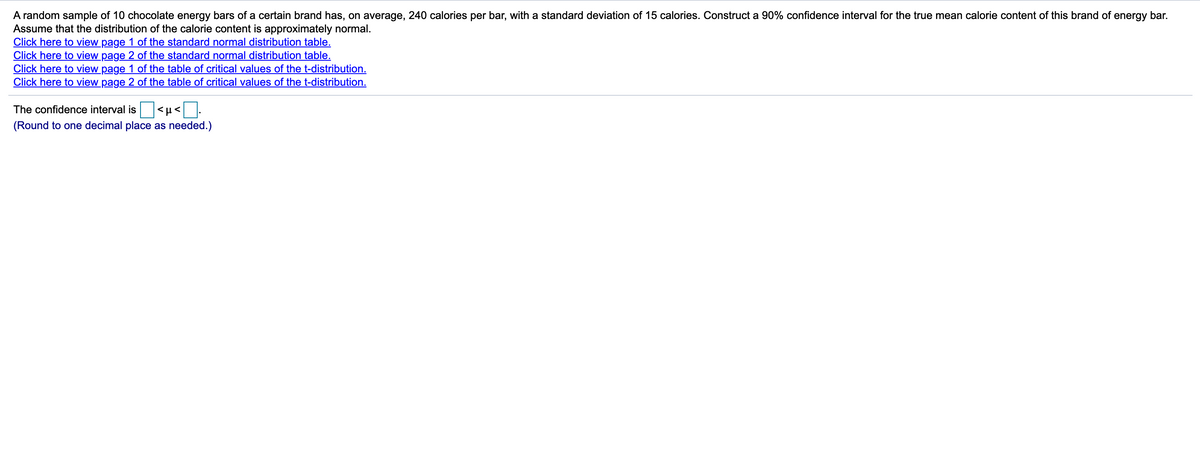
A random sample of 10 chocolate energy bars of a certain brand has, on average, 240 calories per bar, with a standard deviation of 15 calories. Construct a 90% confidence interval for the true mean calorie content of this brand of energy bar. Assume that the distribution of the calorie content is approximately normal. Click here to view page 1 of the standard normal distribution table, Click here to view page 2 of the standard normal distribution table. Click here to view page 1 of the table of critical values of the t-distribution. Click here to view page 2 of the table of critical values of the t-distribution, The confidence interval is
A random sample of 10 chocolate energy bars of a certain brand has, on average, 240 calories per bar, with a standard deviation of 15 calories. Construct a 90% confidence interval for the true mean calorie content of this brand of energy bar. Assume that the distribution of the calorie content is approximately normal. Click here to view page 1 of the standard normal distribution table, Click here to view page 2 of the standard normal distribution table. Click here to view page 1 of the table of critical values of the t-distribution. Click here to view page 2 of the table of critical values of the t-distribution, The confidence interval is

MATLAB: An Introduction with Applications
6th Edition
ISBN:9781119256830
Author:Amos Gilat
Publisher:Amos Gilat
Chapter1: Starting With Matlab
Section: Chapter Questions
Problem 1P

Related questions

Question
Transcribed Image Text:A random sample of 10 chocolate energy bars of a certain brand has, on average, 240 calories per bar, with a standard deviation of 15 calories. Construct a 90% confidence interval for the true mean calorie content of this brand of energy bar.
Assume that the distribution of the calorie content is approximately normal.
Click here to view page 1 of the standard normal distribution table.
Click here to view page 2 of the standard normal distribution table.
Click here to view page 1 of the table of critical values of the t-distribution.
Click here to view page 2 of the table of critical values of the t-distribution.
The confidence interval is <µ<
(Round to one decimal place as needed.)
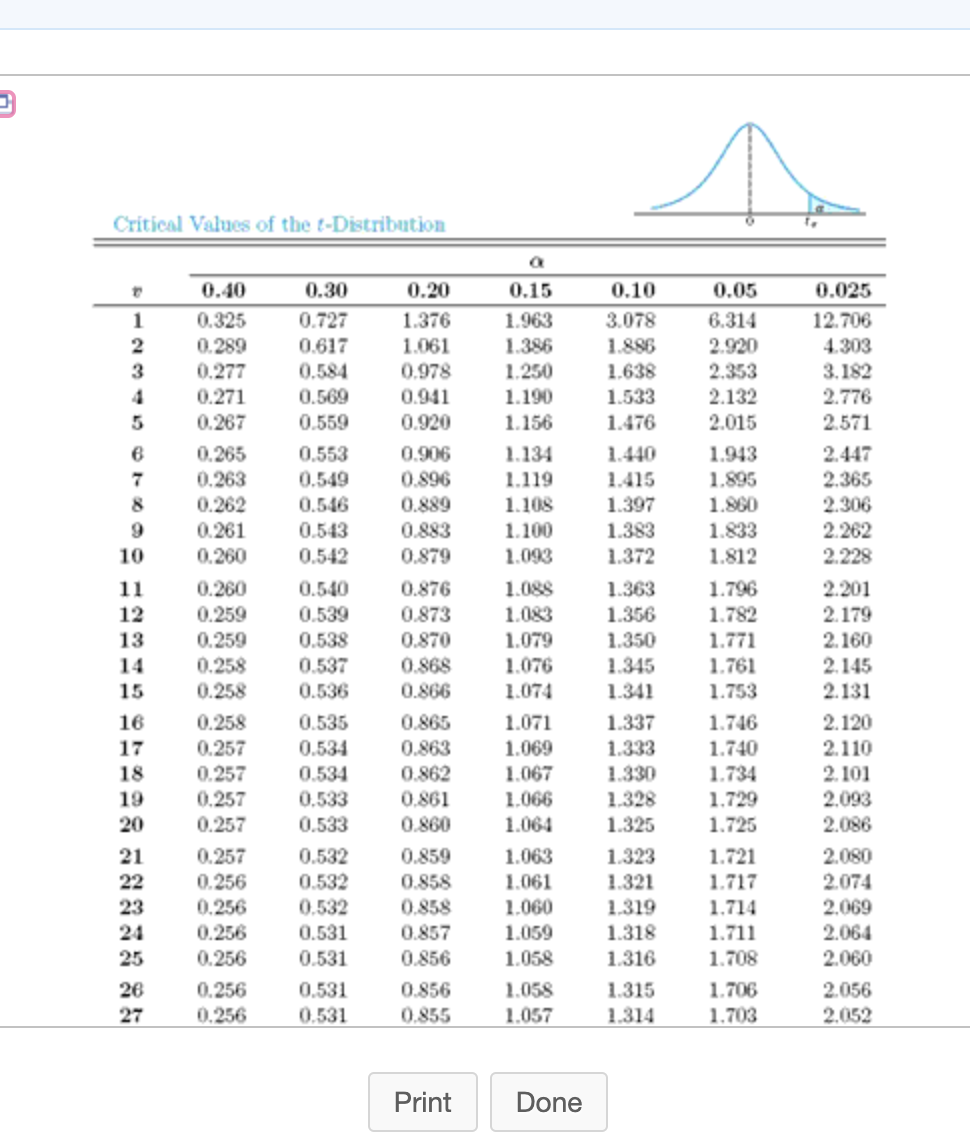
Transcribed Image Text:Critical Values of the t-Distribution
0.40
0.30
0.20
0.15
0.10
0.05
0.025
1
0.325
0.727
1.376
1.963
3.078
6.314
12.706
0.289
0.277
4.303
3.182
1.386
1.886
1.638
1.533
2
0.617
1.061
2.920
3
0.584
0.978
1.250
2.353
4
0.271
0.569
0.941
1.190
2.132
2.776
0.267
0.559
0.920
1.156
1.476
2.015
2.571
0.265
0.263
0.906
0.896
6
0.553
1.134
1.440
1.943
2.447
0.549
0.546
1.895
1.860
1.833
2.365
2.306
1.119
1.415
0.262
0.261
0.260
8
0.889
1.108
1.397
0.543
0.542
9
0.883
1.100
1.383
2.262
10
0.879
1.093
1.372
1.812
2.228
11
0.260
0.540
0.876
1.088
1.363
1.796
2.201
1.083
1.079
1.076
1.356
1.350
12
0.259
0.539
0.873
1.782
2.179
0.259
0.258
0.258
0.538
0.537
0.870
0.868
13
1.771
2.160
1.761
1.753
2.145
2.131
14
1.345
15
0.536
0.866
1.074
1.341
16
0.258
0.535
0.865
1.071
1.337
1.746
2.120
0.534
2.110
2.101
17
0.257
0.863
1.069
1.333
1.740
0.257
0.257
0.534
1.067
1.066
1.330
1.328
1.325
18
0.862
1.734
19
0.533
0.861
1.729
2.093
20
0.257
0.533
0.860
1.064
1.725
2.086
0.257
0.256
0.256
0.256
0.532
0.532
0.859
0.858
1.063
1.323
1.721
2.080
2.074
2.069
2.064
21
22
1.061
1.060
1.059
1.321
1.717
23
1.319
0.532
0.531
0.531
0.858
1.714
24
0.857
1.318
1.711
25
0.256
0.856
1.058
1.316
1.708
2.060
0.256
0.256
26
0.531
0.856
1.058
1.315
1.706
2.056
27
0.531
0.855
1.057
1.314
1.703
2.052
Print
Done
Expert Solution
This question has been solved!
Explore an expertly crafted, step-by-step solution for a thorough understanding of key concepts.

This is a popular solution!

Trending now
This is a popular solution!

Step by step
Solved in 2 steps with 2 images

Knowledge Booster


Learn more about
Need a deep-dive on the concept behind this application? Look no further. Learn more about this topic, statistics and related others by exploring similar questions and additional content below.Recommended textbooks for you
MATLAB: An Introduction with Applications
Statistics
ISBN:
9781119256830
Author:
Amos Gilat
Publisher:
John Wiley & Sons Inc

Probability and Statistics for Engineering and th…
Statistics
ISBN:
9781305251809
Author:
Jay L. Devore
Publisher:
Cengage Learning

Statistics for The Behavioral Sciences (MindTap C…
Statistics
ISBN:
9781305504912
Author:
Frederick J Gravetter, Larry B. Wallnau
Publisher:
Cengage Learning
MATLAB: An Introduction with Applications
Statistics
ISBN:
9781119256830
Author:
Amos Gilat
Publisher:
John Wiley & Sons Inc
Probability and Statistics for Engineering and th…
Statistics
ISBN:
9781305251809
Author:
Jay L. Devore
Publisher:
Cengage Learning
Statistics for The Behavioral Sciences (MindTap C…
Statistics
ISBN:
9781305504912
Author:
Frederick J Gravetter, Larry B. Wallnau
Publisher:
Cengage Learning

Elementary Statistics: Picturing the World (7th E…
Statistics
ISBN:
9780134683416
Author:
Ron Larson, Betsy Farber
Publisher:
PEARSON

The Basic Practice of Statistics
Statistics
ISBN:
9781319042578
Author:
David S. Moore, William I. Notz, Michael A. Fligner
Publisher:
W. H. Freeman

Introduction to the Practice of Statistics
Statistics
ISBN:
9781319013387
Author:
David S. Moore, George P. McCabe, Bruce A. Craig
Publisher:
W. H. Freeman