According to a study conducted by an organization, the proportion of Americans who were afraid to fly in 2006 was 0.10. A random sample of 1,100 Americans results in 99 indicating that they are afraid to fly. Explain why this is not necessarily evidence that the proportion of Americans who are afraid to fly has decreased. Click here to view the standard normal distribution table (page 1). Click here to view the standard normal distribution table (page 2). C Select the correct choice below and, if necessary, fill in the answer box to complete your choice. OA. This is not necessarily evidence that the proportion of Americans who are afraid to fly has decreased below 0.10 because the probability of obtaining a value equal to or more extreme than the sample proportion is which is not unusual. (Round to four decimal places as needed.) OB. This is not necessarily evidence that the proportion of Americans who afraid to fly has decreased below 0.10 because the sample proportion, (Type an integer or a decimal.) is very close to 0.10. OC. This is not necessarily evidence that the proportion of Americans who are afraid to fly has decreased below 0.10 because the value of np(1-p) is less than 10. O D. This is not necessarily evidence that the proportion of Americans who are afraid to fly has decreased below 0.10 because the sample size n is more than 5% of the population.
According to a study conducted by an organization, the proportion of Americans who were afraid to fly in 2006 was 0.10. A random sample of 1,100 Americans results in 99 indicating that they are afraid to fly. Explain why this is not necessarily evidence that the proportion of Americans who are afraid to fly has decreased. Click here to view the standard normal distribution table (page 1). Click here to view the standard normal distribution table (page 2). C Select the correct choice below and, if necessary, fill in the answer box to complete your choice. OA. This is not necessarily evidence that the proportion of Americans who are afraid to fly has decreased below 0.10 because the probability of obtaining a value equal to or more extreme than the sample proportion is which is not unusual. (Round to four decimal places as needed.) OB. This is not necessarily evidence that the proportion of Americans who afraid to fly has decreased below 0.10 because the sample proportion, (Type an integer or a decimal.) is very close to 0.10. OC. This is not necessarily evidence that the proportion of Americans who are afraid to fly has decreased below 0.10 because the value of np(1-p) is less than 10. O D. This is not necessarily evidence that the proportion of Americans who are afraid to fly has decreased below 0.10 because the sample size n is more than 5% of the population.

Holt Mcdougal Larson Pre-algebra: Student Edition 2012
1st Edition
ISBN:9780547587776
Author:HOLT MCDOUGAL
Publisher:HOLT MCDOUGAL
Chapter11: Data Analysis And Probability
Section11.4: Collecting Data
Problem 6E

Related questions
Question
Pls help both in 20 minutes
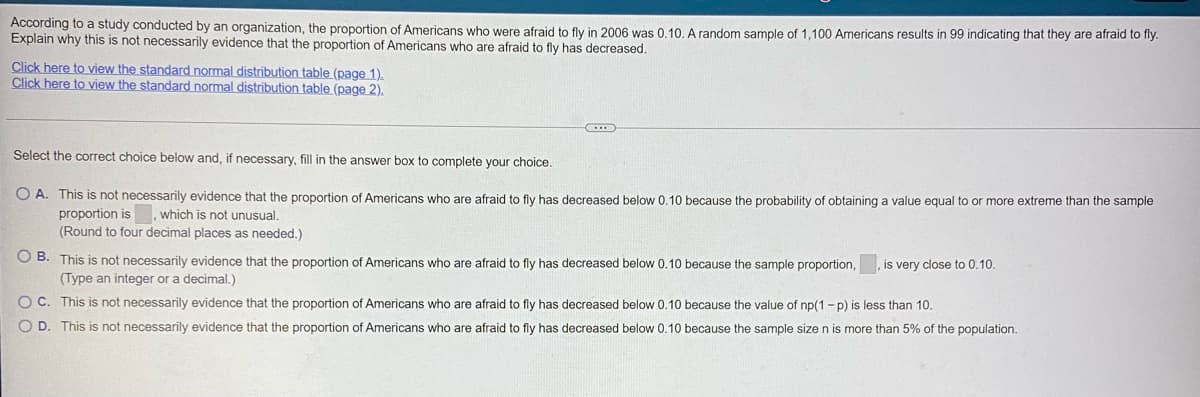
Transcribed Image Text:According to a study conducted by an organization, the proportion of Americans who were afraid to fly in 2006 was 0.10. A random sample of 1,100 Americans results in 99 indicating that they are afraid to fly.
Explain why this is not necessarily evidence that the proportion of Americans who are afraid to fly has decreased.
Click here to view the standard normal distribution table (page 1).
Click here to view the standard normal distribution table (page 2).
(...)
Select the correct choice below and, if necessary, fill in the answer box to complete your choice.
O A. This is not necessarily evidence that the proportion of Americans who are afraid to fly has decreased below 0.10 because the probability of obtaining a value equal to or more extreme than the sample
proportion is which is not unusual.
(Round to four decimal places as needed.)
OB. This is not necessarily evidence that the proportion of Americans who a afraid to fly has decreased below 0.10 because the sample proportion,
(Type an integer or a decimal.)
is very close to 0.10.
OC. This is not necessarily evidence that the proportion of Americans who are afraid to fly has decreased below 0.10 because the value of np(1-p) is less than 10.
O D. This is not necessarily evidence that the proportion of Americans who are afraid to fly has decreased below 0.10 because the sample size n is more than 5% of the population.
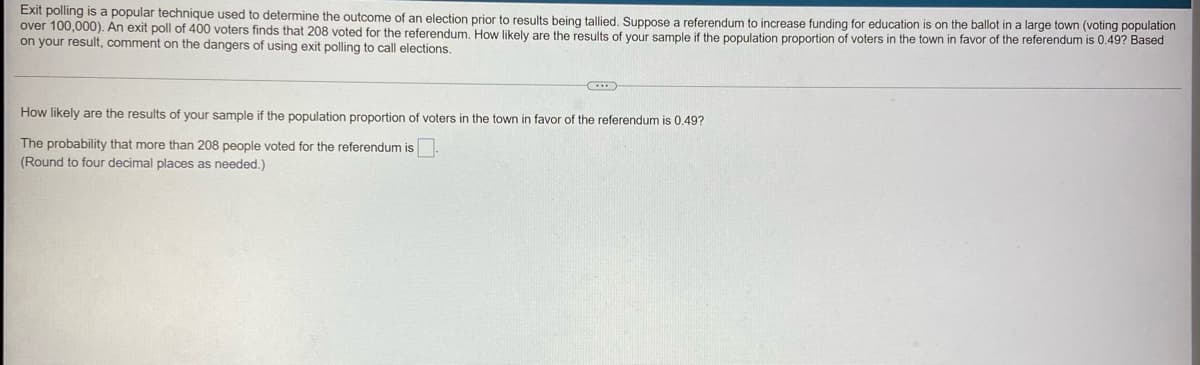
Transcribed Image Text:Exit polling is a popular technique used to determine the outcome of an election prior to results being tallied. Suppose a referendum to increase funding for education is on the ballot in a large town (voting population
over 100,000). An exit poll of 400 voters finds that 208 voted for the referendum. How likely are the results of your sample if the population proportion of voters in the town in favor of the referendum is 0.49? Based
on your result, comment on the dangers of using exit polling to call elections.
C
How likely are the results of your sample if the population proportion of voters in the town in favor of the referendum is 0.49?
The probability that more than 208 people voted for the referendum is
(Round to four decimal places as needed.)
Expert Solution
This question has been solved!
Explore an expertly crafted, step-by-step solution for a thorough understanding of key concepts.

This is a popular solution!

Trending now
This is a popular solution!

Step by step
Solved in 3 steps with 3 images

Recommended textbooks for you
Holt Mcdougal Larson Pre-algebra: Student Edition…
Algebra
ISBN:
9780547587776
Author:
HOLT MCDOUGAL
Publisher:
HOLT MCDOUGAL

Glencoe Algebra 1, Student Edition, 9780079039897…
Algebra
ISBN:
9780079039897
Author:
Carter
Publisher:
McGraw Hill

College Algebra (MindTap Course List)
Algebra
ISBN:
9781305652231
Author:
R. David Gustafson, Jeff Hughes
Publisher:
Cengage Learning
Holt Mcdougal Larson Pre-algebra: Student Edition…
Algebra
ISBN:
9780547587776
Author:
HOLT MCDOUGAL
Publisher:
HOLT MCDOUGAL
Glencoe Algebra 1, Student Edition, 9780079039897…
Algebra
ISBN:
9780079039897
Author:
Carter
Publisher:
McGraw Hill
College Algebra (MindTap Course List)
Algebra
ISBN:
9781305652231
Author:
R. David Gustafson, Jeff Hughes
Publisher:
Cengage Learning