A random sample of 100 automobile owners in a region shows that an automobile is driven on average 25,500 kilometers per year with kilometers. Assume the distribution of measurements to be approximately normal. Construct a 90% prediction interval for the kilometers automobile owner in the region. Click here to view page 1 of the standard normal distribution table. Click here to view page 2 of the standard normal distribution table. Click here to view page 1 of the table of critical values of the t-distribution.
A random sample of 100 automobile owners in a region shows that an automobile is driven on average 25,500 kilometers per year with kilometers. Assume the distribution of measurements to be approximately normal. Construct a 90% prediction interval for the kilometers automobile owner in the region. Click here to view page 1 of the standard normal distribution table. Click here to view page 2 of the standard normal distribution table. Click here to view page 1 of the table of critical values of the t-distribution.

Glencoe Algebra 1, Student Edition, 9780079039897, 0079039898, 2018
18th Edition
ISBN:9780079039897
Author:Carter
Publisher:Carter
Chapter10: Statistics
Section: Chapter Questions
Problem 25SGR

Related questions
Question
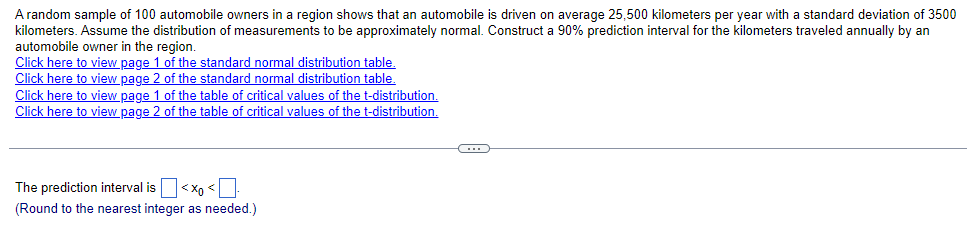
Transcribed Image Text:A random sample of 100 automobile owners in a region shows that an automobile is driven on average 25,500 kilometers per year with a standard deviation of 3500
kilometers. Assume the distribution of measurements to be approximately normal. Construct a 90% prediction interval for the kilometers traveled annually by an
automobile owner in the region.
Click here to view page 1 of the standard normal distribution table.
of the standard normal distribution table.
Click here to view page 2
Click here to view page 1 of the table of critical values of the t-distribution.
Click here to view page 2 of the table of critical values of the t-distribution.
The prediction interval is < X <
(Round to the nearest integer as needed.)
-C
Expert Solution
This question has been solved!
Explore an expertly crafted, step-by-step solution for a thorough understanding of key concepts.

Step by step
Solved in 3 steps with 1 images

Recommended textbooks for you
Glencoe Algebra 1, Student Edition, 9780079039897…
Algebra
ISBN:
9780079039897
Author:
Carter
Publisher:
McGraw Hill
Glencoe Algebra 1, Student Edition, 9780079039897…
Algebra
ISBN:
9780079039897
Author:
Carter
Publisher:
McGraw Hill