During one of the field case-control study of smoking and lung ca istorically important study published compared the smoking histories of group of people cas lung cancer to group of people controls without cancer. Data on average use of tobacco dur past 20 years where classes-Number of cigarettes per day, F Number of people with lung G-Number of people without lung cancer, was classified as follows: Non-smoker Moderately Heavy smoker smoker or Light 0-4 5-9 10-14 10 60 97 147 Find the following static for number of cigarettes per day: Distribution\Smokers classes F G , Median of each of F and G. of each of F and G SC 12 82 15-19 20-24 71 83 274 60 Mode of each of F and G. Excessive smoker 25-29 91 50 Chain s 30-34 101 40 Percentile 50 core of first class of G.
During one of the field case-control study of smoking and lung ca istorically important study published compared the smoking histories of group of people cas lung cancer to group of people controls without cancer. Data on average use of tobacco dur past 20 years where classes-Number of cigarettes per day, F Number of people with lung G-Number of people without lung cancer, was classified as follows: Non-smoker Moderately Heavy smoker smoker or Light 0-4 5-9 10-14 10 60 97 147 Find the following static for number of cigarettes per day: Distribution\Smokers classes F G , Median of each of F and G. of each of F and G SC 12 82 15-19 20-24 71 83 274 60 Mode of each of F and G. Excessive smoker 25-29 91 50 Chain s 30-34 101 40 Percentile 50 core of first class of G.

Glencoe Algebra 1, Student Edition, 9780079039897, 0079039898, 2018
18th Edition
ISBN:9780079039897
Author:Carter
Publisher:Carter
Chapter10: Statistics
Section10.6: Summarizing Categorical Data
Problem 27PPS

Related questions
Question
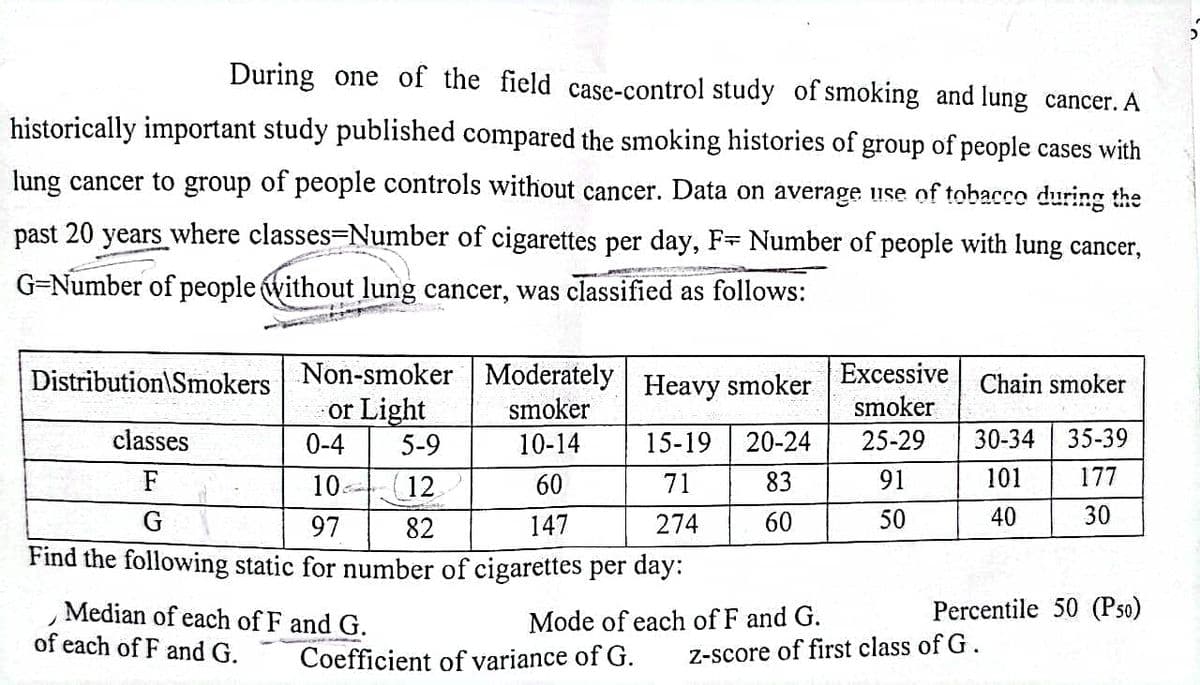
Transcribed Image Text:During one of the field case-control study of smoking and lung cancer. A
historically important study published compared the smoking histories of group of people cases with
lung cancer to group of people controls without cancer. Data on average use of tobacco during the
past 20 years where classes Number of cigarettes per day, F Number of people with lung cancer,
G-Number of people without lung cancer, was classified as follows:
Non-smoker Moderately
smoker
10-14
10
60
G
97
147
Find the following static for number of cigarettes per day:
Distribution\Smokers
classes
or Light
0-4 5-9
12
82
Median of each of F and G.
of each of F and G. Coefficient of variance of G.
Heavy smoker
15-19 20-24
71
83
274
60
Mode of each of F and G.
Excessive
smoker
25-29
91
50
Chain smoker
30-34 35-39
101 177
40
30
Percentile 50 (P50)
z-score of first class of G.
Expert Solution
This question has been solved!
Explore an expertly crafted, step-by-step solution for a thorough understanding of key concepts.

Step by step
Solved in 4 steps

Recommended textbooks for you
Glencoe Algebra 1, Student Edition, 9780079039897…
Algebra
ISBN:
9780079039897
Author:
Carter
Publisher:
McGraw Hill

Big Ideas Math A Bridge To Success Algebra 1: Stu…
Algebra
ISBN:
9781680331141
Author:
HOUGHTON MIFFLIN HARCOURT
Publisher:
Houghton Mifflin Harcourt
Glencoe Algebra 1, Student Edition, 9780079039897…
Algebra
ISBN:
9780079039897
Author:
Carter
Publisher:
McGraw Hill
Big Ideas Math A Bridge To Success Algebra 1: Stu…
Algebra
ISBN:
9781680331141
Author:
HOUGHTON MIFFLIN HARCOURT
Publisher:
Houghton Mifflin Harcourt