A random sample of 175 students was selected from a large high school. They were each asked their cur grade level and whether they have a driver's license. The responses are displayed in the table. Grade Level 9th 10th 11th 12th Yes 1 21 48 Driver's License? No 28 42 20 10 The principal would like to know if these data provide convincing evidence of a relationship between grad and having a driver's license in the population of all students in her school. The random and 10% conditio met, and this table of expected counts shows that all expected counts are at least 5. Grade Level 9th 10th 11th 12th Yes 12.43 20.14 17.57 24.86 Driver's License? No 16.57 26.86 23.43 33.14 What is the value of the chi-square test statistic for this test?
A random sample of 175 students was selected from a large high school. They were each asked their cur grade level and whether they have a driver's license. The responses are displayed in the table. Grade Level 9th 10th 11th 12th Yes 1 21 48 Driver's License? No 28 42 20 10 The principal would like to know if these data provide convincing evidence of a relationship between grad and having a driver's license in the population of all students in her school. The random and 10% conditio met, and this table of expected counts shows that all expected counts are at least 5. Grade Level 9th 10th 11th 12th Yes 12.43 20.14 17.57 24.86 Driver's License? No 16.57 26.86 23.43 33.14 What is the value of the chi-square test statistic for this test?

Glencoe Algebra 1, Student Edition, 9780079039897, 0079039898, 2018
18th Edition
ISBN:9780079039897
Author:Carter
Publisher:Carter
Chapter10: Statistics
Section: Chapter Questions
Problem 13PT

Related questions
Question
17
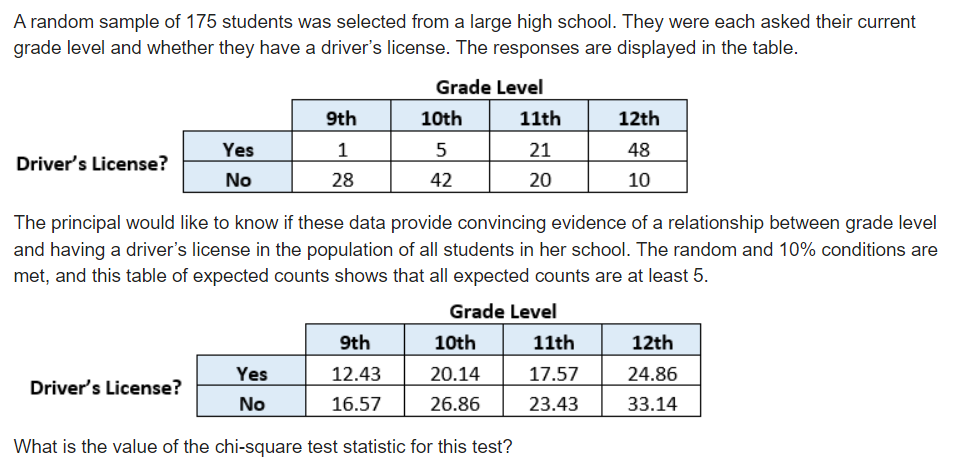
Transcribed Image Text:A random sample of 175 students was selected from a large high school. They were each asked their current
grade level and whether they have a driver's license. The responses are displayed in the table.
Grade Level
9th
10th
11th
12th
Yes
1
5
21
48
Driver's License?
No
28
42
20
10
The principal would like to know if these data provide convincing evidence of a relationship between grade level
and having a driver's license in the population of all students in her school. The random and 10% conditions are
met, and this table of expected counts shows that all expected counts are at least 5.
Grade Level
9th
10th
11th
12th
Yes
12.43
20.14
17.57
24.86
Driver's License?
No
16.57
26.86
23.43
33.14
What is the value of the chi-square test statistic for this test?
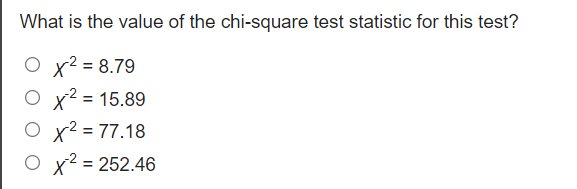
Transcribed Image Text:What is the value of the chi-square test statistic for this test?
O x² = 8.79
О х2%3D 15.89
O x² = 77.18
x² = 252.46
Expert Solution
This question has been solved!
Explore an expertly crafted, step-by-step solution for a thorough understanding of key concepts.

This is a popular solution!

Trending now
This is a popular solution!

Step by step
Solved in 2 steps with 1 images

Recommended textbooks for you
Glencoe Algebra 1, Student Edition, 9780079039897…
Algebra
ISBN:
9780079039897
Author:
Carter
Publisher:
McGraw Hill

Holt Mcdougal Larson Pre-algebra: Student Edition…
Algebra
ISBN:
9780547587776
Author:
HOLT MCDOUGAL
Publisher:
HOLT MCDOUGAL

College Algebra (MindTap Course List)
Algebra
ISBN:
9781305652231
Author:
R. David Gustafson, Jeff Hughes
Publisher:
Cengage Learning
Glencoe Algebra 1, Student Edition, 9780079039897…
Algebra
ISBN:
9780079039897
Author:
Carter
Publisher:
McGraw Hill
Holt Mcdougal Larson Pre-algebra: Student Edition…
Algebra
ISBN:
9780547587776
Author:
HOLT MCDOUGAL
Publisher:
HOLT MCDOUGAL
College Algebra (MindTap Course List)
Algebra
ISBN:
9781305652231
Author:
R. David Gustafson, Jeff Hughes
Publisher:
Cengage Learning