A television station wishes to study the relationship between viewership of its 11 p.m. news program and viewer age (18 years or less, 19 to 35, 36 to 54, 55 or older). A sample of 250 television viewers in each age group is randomly selected, and the number who watch the station's 11 p.m. news is found for each sample. The results are given in the table below. Age Group Watch 55 or 11 p.m. News? Yes 18 or less 19 to 35 36 to 54 Older Total 43 53 56 81 233 No 207 197 194 169 767 Total 250 250 250 250 1,000 (a) Let p1. P2. P3, and P4 be the proportions of all viewers in each age group who watch the station's 11 p.m. news. If these proportions are equal, then whether a viewer watches the station's 11 p.m. news is independent of the viewer's age group. Therefore, we can test the null hypothesis H, that p1, P2. P3, and p4 are equal by carrying out a chi-square test for independence. Perform this test by setting a = .05. (Round your answer to 3 decimal places.) x^2 = HO: independence so (b) Compute a 95 percent confidence interval for the difference between Pi and P4. (Round your answers to 3 decimal places. Negative amounts should be indicated by a minus sign.) 95% Cl: [ 1
A television station wishes to study the relationship between viewership of its 11 p.m. news program and viewer age (18 years or less, 19 to 35, 36 to 54, 55 or older). A sample of 250 television viewers in each age group is randomly selected, and the number who watch the station's 11 p.m. news is found for each sample. The results are given in the table below. Age Group Watch 55 or 11 p.m. News? Yes 18 or less 19 to 35 36 to 54 Older Total 43 53 56 81 233 No 207 197 194 169 767 Total 250 250 250 250 1,000 (a) Let p1. P2. P3, and P4 be the proportions of all viewers in each age group who watch the station's 11 p.m. news. If these proportions are equal, then whether a viewer watches the station's 11 p.m. news is independent of the viewer's age group. Therefore, we can test the null hypothesis H, that p1, P2. P3, and p4 are equal by carrying out a chi-square test for independence. Perform this test by setting a = .05. (Round your answer to 3 decimal places.) x^2 = HO: independence so (b) Compute a 95 percent confidence interval for the difference between Pi and P4. (Round your answers to 3 decimal places. Negative amounts should be indicated by a minus sign.) 95% Cl: [ 1

Glencoe Algebra 1, Student Edition, 9780079039897, 0079039898, 2018
18th Edition
ISBN:9780079039897
Author:Carter
Publisher:Carter
Chapter10: Statistics
Section10.6: Summarizing Categorical Data
Problem 10CYU

Related questions
Question
100%
ch 15 end. 7: A television station wishes to study the relationship between viewership of its 11 p.m. news program and viewer age (18 years or less, 19 to 35, 36 to 54, 55 or older). A sample of 250 television viewers in each age group is randomly selected, and the number who watch the station’s 11 p.m. news is found for each sample. The results are given in the table below.
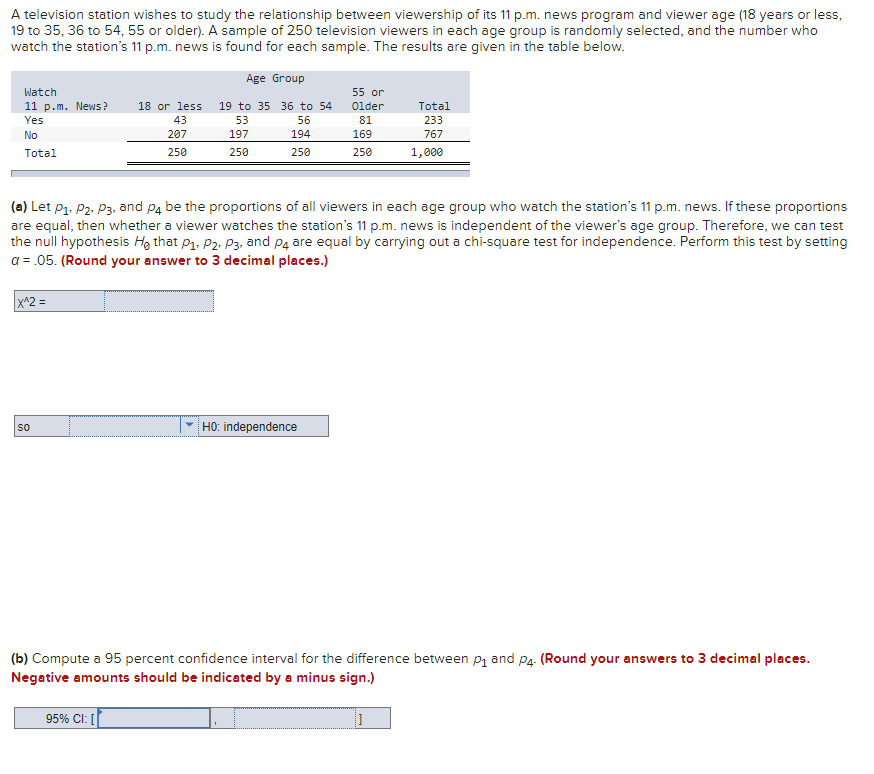
Transcribed Image Text:A television station wishes to study the relationship between viewership of its 11 p.m. news program and viewer age (18 years or less,
19 to 35, 36 to 54, 55 or older). A sample of 250 television viewers in each age group is randomly selected, and the number who
watch the station's 11 p.m. news is found for each sample. The results are given in the table below.
Age Group
Watch
55 or
18 or less
11 p.m. News?
Yes
19 to 35 36 to 54
Older
Total
43
53
56
81
233
No
207
197
194
169
767
Total
250
250
250
250
1,000
(a) Let p1. P2. P3., and Pa be the proportions of all viewers in each age group who watch the station's 11 p.m. news. If these proportions
are equal, then whether a viewer watches the station's 11 p.m. news is independent of the viewer's age group. Therefore, we can test
the null hypothesis He that p1. P2. P3, and Pą are equal by carrying out a chi-square test for independence. Perform this test by setting
a = .05. (Round your answer to 3 decimal places.)
x^2 =
HO: independence
so
(b) Compute a 95 percent confidence interval for the difference between pą and p4. (Round your answers to 3 decimal places.
Negative amounts should be indicated by a minus sign.)
95% CI: [
Expert Solution
This question has been solved!
Explore an expertly crafted, step-by-step solution for a thorough understanding of key concepts.

This is a popular solution!

Trending now
This is a popular solution!

Step by step
Solved in 2 steps with 1 images

Recommended textbooks for you
Glencoe Algebra 1, Student Edition, 9780079039897…
Algebra
ISBN:
9780079039897
Author:
Carter
Publisher:
McGraw Hill

Holt Mcdougal Larson Pre-algebra: Student Edition…
Algebra
ISBN:
9780547587776
Author:
HOLT MCDOUGAL
Publisher:
HOLT MCDOUGAL

Big Ideas Math A Bridge To Success Algebra 1: Stu…
Algebra
ISBN:
9781680331141
Author:
HOUGHTON MIFFLIN HARCOURT
Publisher:
Houghton Mifflin Harcourt
Glencoe Algebra 1, Student Edition, 9780079039897…
Algebra
ISBN:
9780079039897
Author:
Carter
Publisher:
McGraw Hill
Holt Mcdougal Larson Pre-algebra: Student Edition…
Algebra
ISBN:
9780547587776
Author:
HOLT MCDOUGAL
Publisher:
HOLT MCDOUGAL
Big Ideas Math A Bridge To Success Algebra 1: Stu…
Algebra
ISBN:
9781680331141
Author:
HOUGHTON MIFFLIN HARCOURT
Publisher:
Houghton Mifflin Harcourt