A random sample of 25 Berkeley College students was asked, "How many hours per week typically do you work outside the home?" Their responses were as follows: {10,15, 28, 25, 25, 38, 30, 18, 22, 25, 30, 10, 20, 25, 0, 20, 35, 10, 30, 4, 10, 30, 40, 38, 35} a. Find the mean, the median and the mode of hours worked outside the home for the sample data. Show all your work to justify your answer. b. Use the above data to complete the following table summarizing the number of hours worked outside the home. Express the relative frequency as a percent.
A random sample of 25 Berkeley College students was asked, "How many hours per week typically do you work outside the home?" Their responses were as follows: {10,15, 28, 25, 25, 38, 30, 18, 22, 25, 30, 10, 20, 25, 0, 20, 35, 10, 30, 4, 10, 30, 40, 38, 35} a. Find the mean, the median and the mode of hours worked outside the home for the sample data. Show all your work to justify your answer. b. Use the above data to complete the following table summarizing the number of hours worked outside the home. Express the relative frequency as a percent.

Glencoe Algebra 1, Student Edition, 9780079039897, 0079039898, 2018
18th Edition
ISBN:9780079039897
Author:Carter
Publisher:Carter
Chapter10: Statistics
Section10.4: Distributions Of Data
Problem 19PFA

Related questions
Question
Transcribed Image Text:Introduction to Statistics
This PERFORMANCE ASSESSMENT TASK is designed to assess the learner's ability to calculate
the measures of central tendencies, plot the five-number summary, construct relative
frequency chart for a set of data, calculate basic probability, and determine whether there is a
positive, negative or no linear relationship between two variables.
Part I - Measures of Central tendency/Relative Frequency/ the Five-number Summary
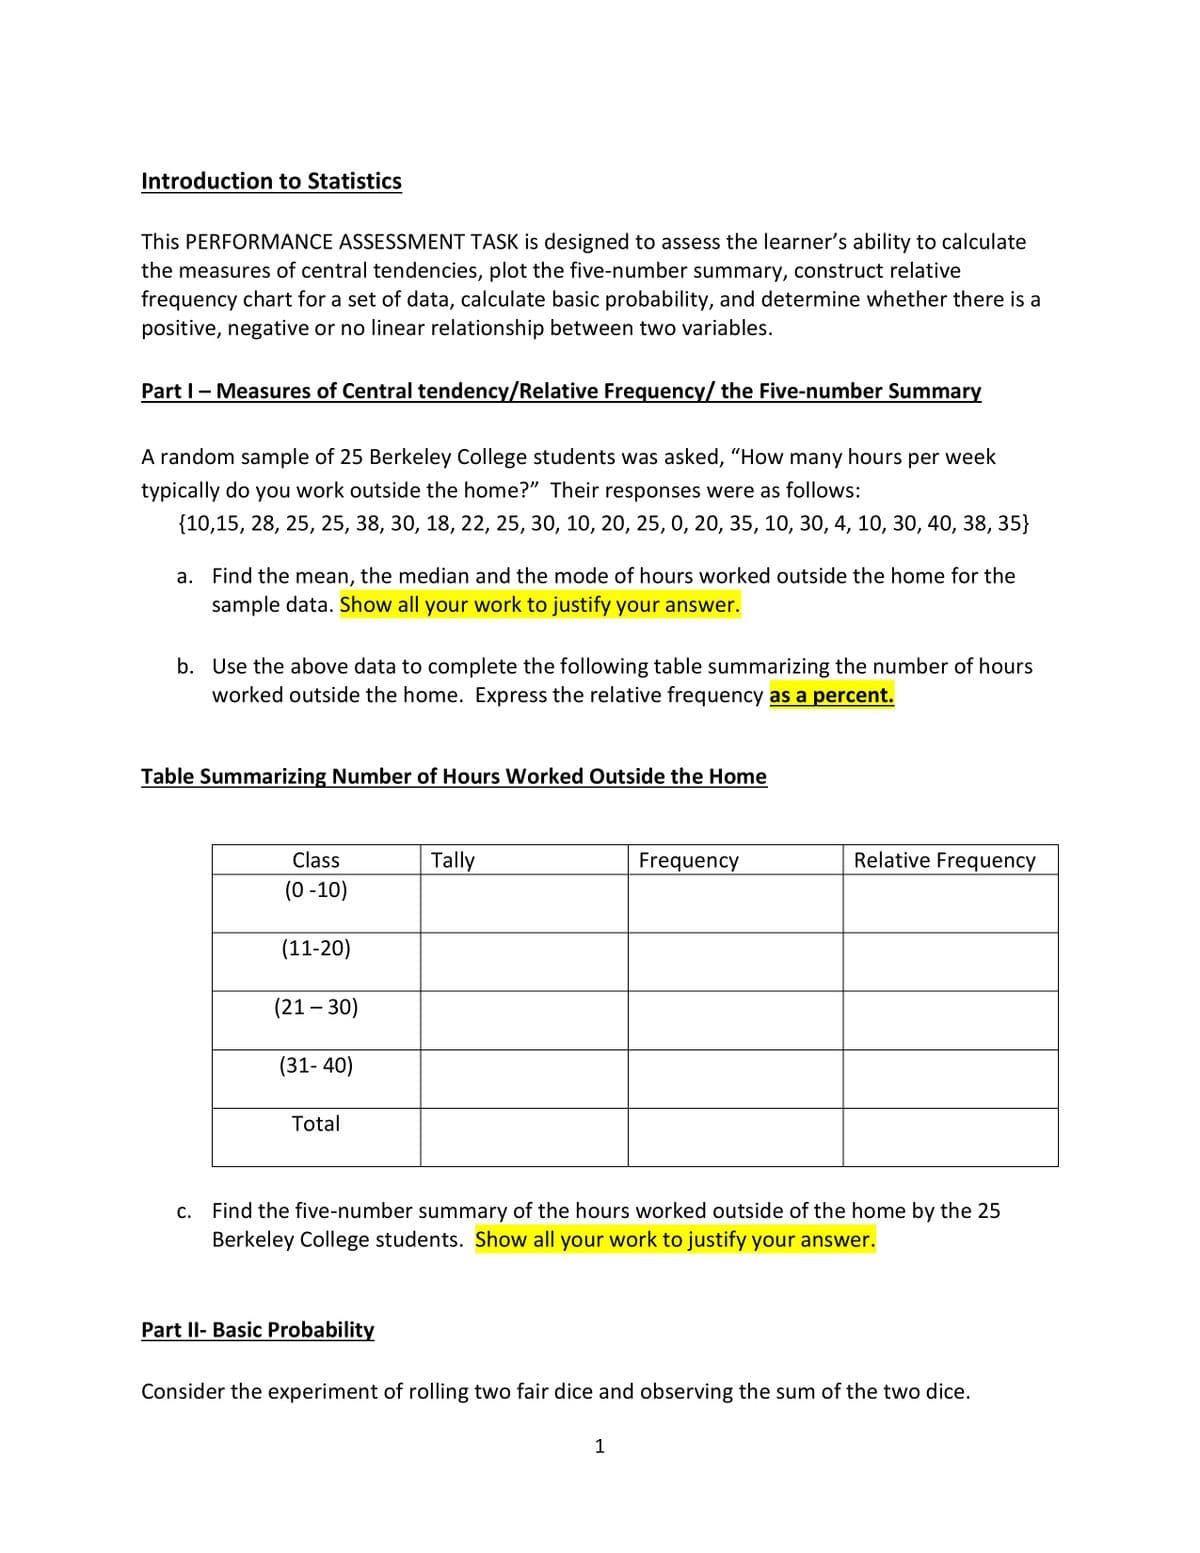
A random sample of 25 Berkeley College students was asked, "How many hours per week
typically do you work outside the home?" Their responses were as follows:
{10,15, 28, 25, 25, 38, 30, 18, 22, 25, 30, 10, 20, 25, 0, 20, 35, 10, 30, 4, 10, 30, 40, 38, 35}
a. Find the mean, the median and the mode of hours worked outside the home for the
sample data. Show all your work to justify your answer.
b. Use the above data to complete the following table summarizing the number of hours
worked outside the home. Express the relative frequency as a percent.
Table Summarizing Number of Hours Worked Outside the Home
Class
(0-10)
(11-20)
(21-30)
(31-40)
Total
Tally
Part II- Basic Probability
Frequency
c. Find the five-number summary of the hours worked outside of the home by the 25
Berkeley College students. Show all your work to justify your answer.
Relative Frequency
1
Consider the experiment of rolling two fair dice and observing the sum of the two dice.
Expert Solution
This question has been solved!
Explore an expertly crafted, step-by-step solution for a thorough understanding of key concepts.

This is a popular solution!

Trending now
This is a popular solution!

Step by step
Solved in 3 steps with 3 images

Recommended textbooks for you
Glencoe Algebra 1, Student Edition, 9780079039897…
Algebra
ISBN:
9780079039897
Author:
Carter
Publisher:
McGraw Hill
Glencoe Algebra 1, Student Edition, 9780079039897…
Algebra
ISBN:
9780079039897
Author:
Carter
Publisher:
McGraw Hill