The following chart summarizes the complaints received at a catalogue sales call centre by day of the week. The chart shows percentages for each day. The complaints are classified as related to delivery (the order has not arrived), fulfilment (an item was missing from an order or not what was ordered), size (an item did not fit), and damage. Discuss: (a) Is the day of the week associated with the nature of the


Q: A group of teenagers is chosen randomly and asked which of three indoor activities they preferred.…
A: It is given that: Total number of teenagers = 126 Number of teenagers preferred listening to music…
Q: The following data were collected from a Repeated-Measures study. Perform an ANOVA. Use…
A: We are given the following table: Person Trial 1 Trial 2 Trial 3 A 0 0 6 B 1 3 6 C…
Q: Let Y be a discrete random variable with support on {-1,0, 1} and with probability mass function…
A: The Maximum Likelihood Estimator of θ, given that the observed value of the random variable, Y is…
Q: The following values represent the distance (in miles) that a sample of 10 dating couples live from…
A: Given the distance (in miles) are :- 6, 93, 4, 3, 6, 11, 21, 16, 6, 9 Total number of data , n…
Q: Select the best possible answer among the choices and show your solutions. Put a box on your final…
A: Title: Conjugate Prior and Standardized Likelihood for Geometric Distribution Introduction:In this…
Q: 22) let XnN20, 036), iF P(X<W) = 0.05 th the value of wis
A: Given that, X~N(μ=20, σ=0.36) To find the value of W when P(X<W)=0.05
Q: In a poll, 1200 adults in a region were asked about their online vs. in-store clothes shopping. One…
A: Answer:- Given, Sample size, n = 1200 Sample proportion, p = 38% = 0.38 Confidence level = 95% =…
Q: Q28 If A is 3 occurrences per five-minute time interval, find the probability of getting occurrences…
A: Note:- "Since you have posted multiple questions, we will provide the solution only to the first…
Q: Critical values for quick reference during this activity. Confidence level Critical value z* = 1.645…
A: From the provided information, Margin of error (E) = 1.59% = 0.0159 Confidence level = 90%
Q: Assume that a sample is used to estimate a population mean . Find the 98% confidence interval for a…
A: Answer:- Given, Sample size, n = 54 Sample mean, X¯ = 84.5 Sample standard deviation, s = 21.6…
Q: A weight-loss clinic advertised that last month its patients, on average, lost 6 lb. Assuming that…
A: It is required to choose the correct statement(s).
Q: The director of the campus computing center did a study to determine the patterns of student…
A: A time series graph is created by drawing an aggregate values on a time line.
Q: Assume that a certain insurer has 1,000 policyholders of type 1 and 2,500 policyholders of type 2.…
A: In this problem, we are given information about an insurance company's policyholders. The insurer…
Q: At Westgate Community College, a survey was done to determine when students are available for class.…
A: It is given that out of total students, 52 would take early-morning classes, 85 would take…
Q: The sample mean X is to be used to estimate the mean u of a normal distribution with standard…
A: The question is about sample size estimation Given : Std. deviation of normal dist. ( σ ) = 4 inches…
Q: The median undergraduate grade point average (GPA) for students accepted at a random sample of 10…
A: The sample size, i.e., the sampled no. of school, n=10. The sample mean, x¯=3.75 And the standard…
Q: For example, from a mortality table, you only know the follow information: Cx lx 30 31 32 33 34…
A: In this problem, we are given a mortality table that provides information about the mortality…
Q: Practice: 1) Find the number of possible outcomes. List all the possible outcomes. A stack of cards…
A: “Since you have posted multiple questions, we will provide the solution only to the first question…
Q: The following are the P/E ratios (price of stock divided by projected earnings per share) for 15…
A: The following are the P/E ratios (price of stock divided by projected earnings per share) for 15…
Q: A group of people were asked if some psychics can help solve murder cases. 220 responded "yes", and…
A: Responded Yes = 220 Responded no = 482 Total = 702
Q: Telephone interviews of random sample of 57 dental patients are performed and each person is asked…
A: It is needed to define the parameter and statistic.
Q: 1. If you increase the confidence level you would expect the confidence interval to be because to be…
A: The confidence interval is the range of values within which the value of population parameter is…
Q: TOPIC: MARKOV CHAINS In a sample of 400 Internet subscribers taken in late 2000, 80% were connected…
A: In a sample of 400 Internet subscribers taken in late 2000, 80% were connected by telephone, and the…
Q: In a biology class, there are 40 students, 18 of whom are female and 22 are male. If two students…
A:
Q: Guide a hypothesis test by establishing Hypothesis, - Type of test, - Decision rule, and conclusion…
A: The data is given as- x¯1=450S1=120n1=10x¯2=420S2=150n2=12
Q: 11. Which of the following are characteristics of a stochastic process i) It has constant mean and…
A:
Q: What is the appropriate statistical test to identify any significant difference between Gender…
A: The dataset for gender group and patients' albumin level is given. We have to obtain the test which…
Q: How many data points are presented in the histogram? 5 4 3 2 1 0 0 1 2 3 4 5 6 7 8 9 10 11
A: The number of data points that are presented in the Histogram is determined below as follows: From…
Q: A record of a chess match records the chess piece used, the location of the piece and the length of…
A: The variables are: chess piece used, the location of the piece and the length of time used to make…
Q: The diameters of apples grown in an orchard are normally 3.4 and standard deviation 0.4 inches. (a)…
A: Mean μ=3.4 Standard deviation σ=0.4
Q: Find 24th percentile, P24, from the following data 130 140 160 190 200 210 230 300 310 410 440 450…
A: Answer:- Given the following data 130, 140, 160, 190, 200, 210, 230, 300, 310, 410,…
Q: Suppose you have been hired by a political consulting firm. Your task is to use data to predict…
A: That is, there is no evidence to conclude that the population proportion of votes cast is more than…
Q: Data set One Results below represent caloric content of different foods 405 580 300 320 720 470 530…
A: Arrange the given data in ascending order 225 , 290, 290, 295, 300, 320, 320, 330, 340, 390, 390,…
Q: Suppose the change in price from 2012 to 2013 for 10 houses in Toronto is measured (in percent) for…
A: Comment: As per the our company guidelines we are supposed to answer only three subparts. Kindly…
Q: Data set One Results below represent caloric content of different foods 390 405 580 300 320 540 225…
A: x x2 390 152100 540 291600 535 286225 390 152100 320 102400 430 184900 405 164025…
Q: 2. What is the expected number of trials needed in order for all faces of a symmetric die to have…
A: Considering the die is symmetric, each face has an equal chance of appearance, i.e., Pi=16;…
Q: Pyramid Lake, Nevada, is described as the pride of the Paiute Indian Nation. It is a beautiful…
A: The data shows the elevation of the lake surface varies according to the annual flow.
Q: Data set One Results below represent caloric content of different foods 390 405 580 300 320 540 225…
A: We have given data are x:…
Q: Let X₁, X2, ..., Xn, be independent random variables such that Xj ~ N(j 0, 1) with j = 1,..., n. (a)…
A:
Q: The following results come from two independent random samples taken of two populations. Sample 1 n₁…
A: n1=40, x¯1=13.2, σ1=2.4n2=35, x¯2=11.4, σ2=3.3
Q: Use R to simulate N and compute T 104 random samples (Z₁,..., Zn) from the normal(0,1) distribution…
A: In this exercise, we are asked to use the R programming language to simulate N = 104 random samples…
Q: Find the margin of error for the 95% confidence interval used to estimate the population proportion.…
A: Confidence level = 95% Sample size (n) = 2440 Sample proportion (p̂) = 0.70
Q: In running a regression model with heteroscedastic errors, the estimators given by Weighted Least…
A: Weighted Least Squares (WLS) is a regression analysis technique employed to handle…
Q: what percent of values fall between 5.25 and 8.75 if the mean =9 and standard deviation =2.36
A: Answer: From the given data, Mean (μ) = 9 Standard deviation (σ) = 2.36 X follows normal…
Q: Let X ~t(30). Use tables to determine the values b, c such that P(-b≤X ≤ b) = 0.90; P(X > c) =…
A: We have given that, X~t30 i.e. The random variable X follows a t-distribution with 30 degrees of…
Q: A scientist measured the diameters of 10,000 cells and graphed a histogram of their sizes. Frequency…
A: Total cells=10000 So cells greater than 12 micrometers=(cells between 12-13)+(cells between…
Q: 1. Perform a least-squares regression analysis on Camp Rainbow's data. 2. Using the regression…
A: The question provides data on the number of campers and the corresponding cost to run the camp for…
Q: A normal distribution has a mean of 19 and a standard deviation of 5. Use the 68-95-99.7 rule to…
A: Mean(µ) = 19Standard deviations (σ) = 5X ~ N (µ, σ )= N(19, 5)
Q: There is very close to an even chance that both children in a two-child family will be of the same…
A: We are given that: There is very close to an even chance that both children in a two-child family…
Q: Landings 300,000,000 200,000,000 100,000,000 Market Squid in Northern California 2018 2014 2010 2006…
A: In this analysis, we are presented with a dataset that includes the yearly landings of squid (in…
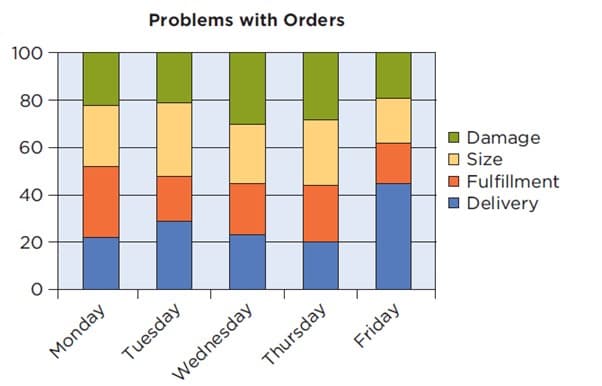
The following chart summarizes the complaints received at a catalogue sales call centre by day of the week. The chart shows percentages for each day. The complaints are classified as related to delivery (the order has not arrived), fulfilment (an item was missing from an order or not what was ordered), size (an item did not fit), and damage.
Discuss:
(a) Is the day of the week associated with the nature of the complaint? Explain why you think that these variables are or are not associated.
(b) What supplemental information that is not shown by the chart is important to managers in charge of dealing with complaints?

Step by step
Solved in 3 steps

- 0.7200.7400.6400.3900.7002.2001.9800.6401.2200.2001.6401.3402.9500.9001.7601.0101.2600.0000.6501.4601.6201.8300.9901.5600.4101.2800.8301.3200.5401.2500.9201.0000.7800.7901.4401.0002.2402.5001.7901.2501.4900.8401.4201.0001.2501.4201.3500.9300.4001.390 The accompanying data table lists the magnitudes of 50 earthquakes measured on the Richter scale. Test the claim that the population of earthquakes has a mean magnitude greater than 1.00. Use a 0.01significance level. Identify the null hypothesis, alternative hypothesis, test statistic, P-value, and conclusion for the test. Assume this is a simple random sample the sample data is above. What are the hypotheses? A. H0: μ=1.00 in magnitude H1: μ≠1.00 in magnitude B. H0: μ=1.00 in magnitude H1: μ<1.00 in magnitude C. H0: μ=1.00 in magnitude H1: μ>1.00 in magnitude D. H0: μ≠1.00 in magnitude H1: μ=1.00 in magnitude Identify the test statistic. t= (Round to two decimal places as…273927397294792749273927942794729×73468263827398293820831 Data: Red Blue Brown Green Yellow0.744 0.844 0.918 0.942 0.8680.813 0.726 0.743 0.798 0.7240.997 0.717 0.818 0.727 0.7540.927 0.882 0.994 0.842 0.9510.825 0.969 0.997 0.828 0.771 0.993 0.918 0.854 0.999 0.786 0.963 0.972 0.872 0.904 0.752
- Lower class 0.08 0.33 0.58 0.75 0.83 1 1 1 1 1 1 1 2 2 2 2 2 2 2 2 3 3 3 3 3 3 4 4 4 4 4 4 4 5 5 5 5 5 5 6 6 7 7 7 7 7 7 7 8 8 8 8 9 9 9 9 9 9 9 9 10 10 10 10 10 10 11 11 11 11 12 12 13 14 14 14 14 14 14 15 15 15 15 15 16 16 16 16 16 16 16 16 16 16 16 16 16 16 16 16 16 17 17 17 17 17 17 17 17 17 17 17 17 17 17 17 17 17 18 18 18 18 18 18 18 18 18 18 18 18 18 18 18 18 18 18 18 18 18 18 18 18 18 18 18 18 19 19 19 19 19 19 19 19 19 19 19 19 19 19 19 19 19 19 19 19 19 19 19 19 19 19 19 19 19 19 19 20 20 20 20 20 20 20 20 20 20 20 20 20 20 20 20 20 20 20 20 20 20 20 20…Price SqFt 600000 2767 545000 2731 314900 2051 419000 2084 365000 2270 479000 1950 323000 1235 339900 2116 399000 1644 552000 2415 223017 1375 315777 1529 499000 2223 575000 2327 342000 1879 375000 1558 349000 2012 485000 1200 549888 1410 295000 1943 399000 1827 306999 1840 265200 1636 479000 2357 249700 1152 539500 2650 365000 2154 295900 1279 499000 2156 526000 2493 514900 2390 346000 1347 460000 2120 389000 1917 499000 1200 405000 2643 389900 1789 545000 2327 339000 1742 425000 1746 479000 1421 392000 2569 Interpret b0 in the context of this problem. Interpret b1 in the context of this problem. What percent of total variation in prices is explained by the regression model? Provide evidence to support your answer. Please include the excel function.40 Numbers: Restaurant X Restaurant Y81 102123 129123 154147 112266 173178 134125 106157 120157 131212 123336 134311 132175 229111 213160 294145 12993 90234 137237 245185 145157 144202 199173 151117 14268 135198 146179 156112 136138 165173 138187 245194 232236 252190 236347 237304 171212 82200 110182 51184 174102 82145 145172 143156 101171 123159 146164 127128 182131 149309 127
- Precision Recall0.01 0.010.02 0.020.03 0.030.04 0.040.05 0.050.06 0.060.07 0.070.08 0.080.09 0.090.1 0.10.11 0.110.12 0.120.13 0.130.14 0.140.15 0.150.16 0.160.17 0.170.18 0.180.19 0.190.2 0.20.21 0.210.22 0.220.23 0.230.24 0.240.25 0.250.26 0.260.27 0.270.28 0.280.29 0.290.3 0.30.31 0.310.32 0.320.33 0.330.34 0.340.35 0.350.36 0.360.37 0.370.38 0.380.39 0.390.4 0.40.41 0.410.42 0.420.43 0.430.44 0.440.45 0.450.46 0.460.47 0.470.48 0.480.49 0.490.5 0.50.51 0.510.52 0.520.53 0.530.54 0.540.55…Paint 1 652 648 648 656 652 655 644 649 655 643 Paint 2 688 706 695 697 711 693 712 699 696 695 Paint 3 684 703 702 714 695 709 690 705 703 696 Paint 4 706 693 699 715 703 691 702 703 707 690 Paint 5 709 698 700 698 700 700 697 706 706 694 Five different paints are marketed as having same drying time. To verify the manufacturer’s claim, the dry times were measured in seconds and recorded. Test the claim that the drying times are equal at a=0.05.Wins Attendance (In Millions) 65 2.06 91 2.51 66 1.73 89 3.05 75 3.06 88 2.19 91 2.06 69 1.39 83 2.88 81 2.46 80 1.54 76 2.33 67 1.62 80 3.25 80 3.56 77 2.78 94 3.22 79 2.56 95 3.77 81 1.42 97 3.65 57 1.61 90 2.13 92 3.04 61 2.09 86 3.3 96 1.84 90 2.51 85 1.63 69 1.83 Draw a scatter diagram depicting the correlation between the two variables. Determine the correlation coefficient between the two variables using Excel. Present a regression output between a dependent and one independent variable. Obtain estimated coefficients and R-squared and interpret them. Write a short report on the findings.
- Number of ChildrenTable 1 shows the number of women (per 1000) between 15 and 50 years of age who have been married grouped by the number of children they have had. Table 2 gives the same information for women who have never been married.1 Number of Children Women per 1000 0 162 1 213 2 344 3 182 4 69 5+ 32 Table 1 Women who have been married Number of Children Women per 1000 0 752 1 117 2 72 3 35 4 15 5+ 10 Table 2 Women who have never been married 1http://www.census.gov/hhes/fertility/data/cps/2014.html, Table 1, June 2014. Condition gt requires numbers instead of "null" and "0" (a) Without doing any calculations, which of the two samples appears to have the highest mean number of children? Women who have been marriedWomen who have never been married Which of the distributions appears to have the mean most different from the median? Women who have been marriedWomen who have never been married…Sale Price 9950 6536 11554 10049 11542 9339 11022 9858 6863 10912 12028 7661 10783 8959 6602 10123 10234 7104 8970 8490 9682 8208 9496 8352 12003 12260 12824 9733 10592 12232 13010 11725 6700 13104 11166 12684 12293 8152 7110 11255 8361 11550 9871 6634 11298 7594 6258 9413 10991 9304What I Can DoCOVID -19 RecoveriesThe ongoing pandemic of corona virus disease 2019, a novel infectious disease causedby severe acute respiratory syndrome was spread in the Philippines onJanuary 30, 2020. Thousands of people in the country tested positive in this virus, and some ofthem recovered from the disease. The following table shows the number of recoveries from April24-May 3, 2020DateApril 24April 25April 26April 27April 28April 29April 30May 1May 2May 3Number of Recoveries X40307070434820414090a. Illustrate the probability distribution if X is the random variable that represents the number ofrecoveries.b. What safety precautions will you undertake to help avoid the spread of the COVID-19ppandemica