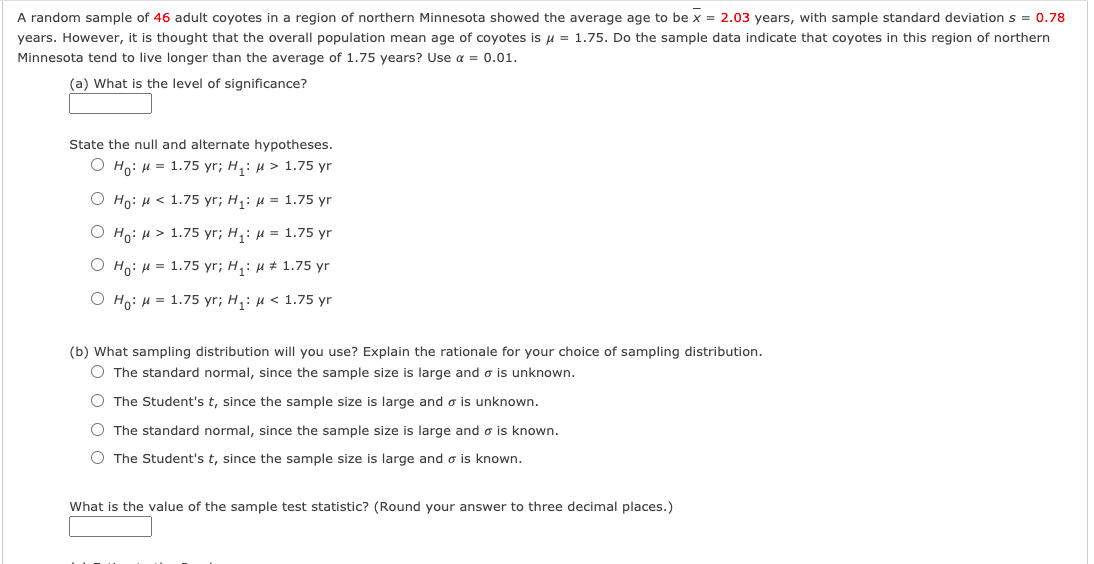
A random sample of 46 adult coyotes in a region of northern Minnesota showed the average age to be x = 2.03 years, with sample standard deviation s = 0.78 vears. However, it is thought that the overall population mean age of coyotes is u = 1.75. Do the sample data indicate that coyotes in this region of northern Minnesota tend to live longer than the average of 1.75 years? Use a = 0.01. (a) What is the level of significance? State the null and alternate hypotheses. О но: и 3 1.75 yг; н,: и» 1.75 уг Ο Hρ: μ< 1.75 yr; Η1: μ= 1.75 yr О но: и> 1.75 yг; н,: и 3D 1.75 yг О на и 3 1.75 уг; н,: и * 1.75 уг О н: и 3 1.75 yr; H,: и < 1.75 yг (b) What sampling distribution will you use? Explain the rationale for your choice of sampling distribution. O The standard normal, since the sample size is large and o is unknown. O The Student's t, since the sample size is large and o is unknown. O The standard normal, since the sample size is large and o is known. O The Student's t, since the sample size is large and o is known. What is the value of the sample test statistic? (Round your answer to three decimal places.)


Correlation
Correlation defines a relationship between two independent variables. It tells the degree to which variables move in relation to each other. When two sets of data are related to each other, there is a correlation between them.
Linear Correlation
A correlation is used to determine the relationships between numerical and categorical variables. In other words, it is an indicator of how things are connected to one another. The correlation analysis is the study of how variables are related.
Regression Analysis
Regression analysis is a statistical method in which it estimates the relationship between a dependent variable and one or more independent variable. In simple terms dependent variable is called as outcome variable and independent variable is called as predictors. Regression analysis is one of the methods to find the trends in data. The independent variable used in Regression analysis is named Predictor variable. It offers data of an associated dependent variable regarding a particular outcome.
HOw would you figure this out?

Step by step
Solved in 2 steps with 3 images


