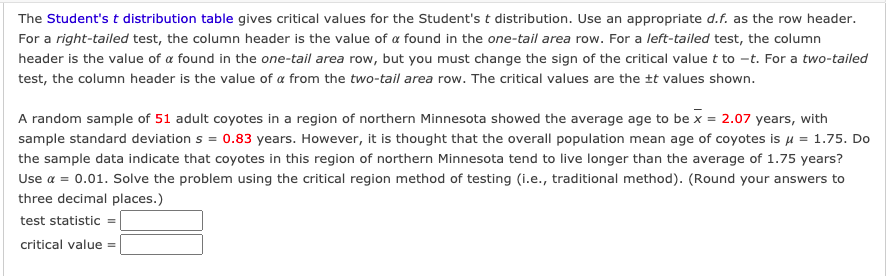
A random sample of 51 adult coyotes in a region of northern Minnesota showed the average age to be x = 2.07 years, with sample standard deviation s = 0.83 years. However, it is thought that the overall population mean age of coyotes is u = 1.75. Do the sample data indicate that coyotes in this region of northern Minnesota tend to live longer than the average of 1.75 years? Use a = 0.01. Solve the problem using the critical region method of testing (i.e., traditional method). (Round your answers to three decimal places.) test statistic = critical value =


Correlation
Correlation defines a relationship between two independent variables. It tells the degree to which variables move in relation to each other. When two sets of data are related to each other, there is a correlation between them.
Linear Correlation
A correlation is used to determine the relationships between numerical and categorical variables. In other words, it is an indicator of how things are connected to one another. The correlation analysis is the study of how variables are related.
Regression Analysis
Regression analysis is a statistical method in which it estimates the relationship between a dependent variable and one or more independent variable. In simple terms dependent variable is called as outcome variable and independent variable is called as predictors. Regression analysis is one of the methods to find the trends in data. The independent variable used in Regression analysis is named Predictor variable. It offers data of an associated dependent variable regarding a particular outcome.
How would you figure this out?


Trending now
This is a popular solution!

Step by step
Solved in 2 steps with 1 images


