A random sample of 55 observations was taken. The average in the sample was 103 with a variance of 500. a) Construct a 95% confidence interval for . b) Construct a 99% confidence interval for .
A random sample of 55 observations was taken. The average in the sample was 103 with a variance of 500. a) Construct a 95% confidence interval for . b) Construct a 99% confidence interval for .

MATLAB: An Introduction with Applications
6th Edition
ISBN:9781119256830
Author:Amos Gilat
Publisher:Amos Gilat
Chapter1: Starting With Matlab
Section: Chapter Questions
Problem 1P

Related questions

Topic Video
Question
100%
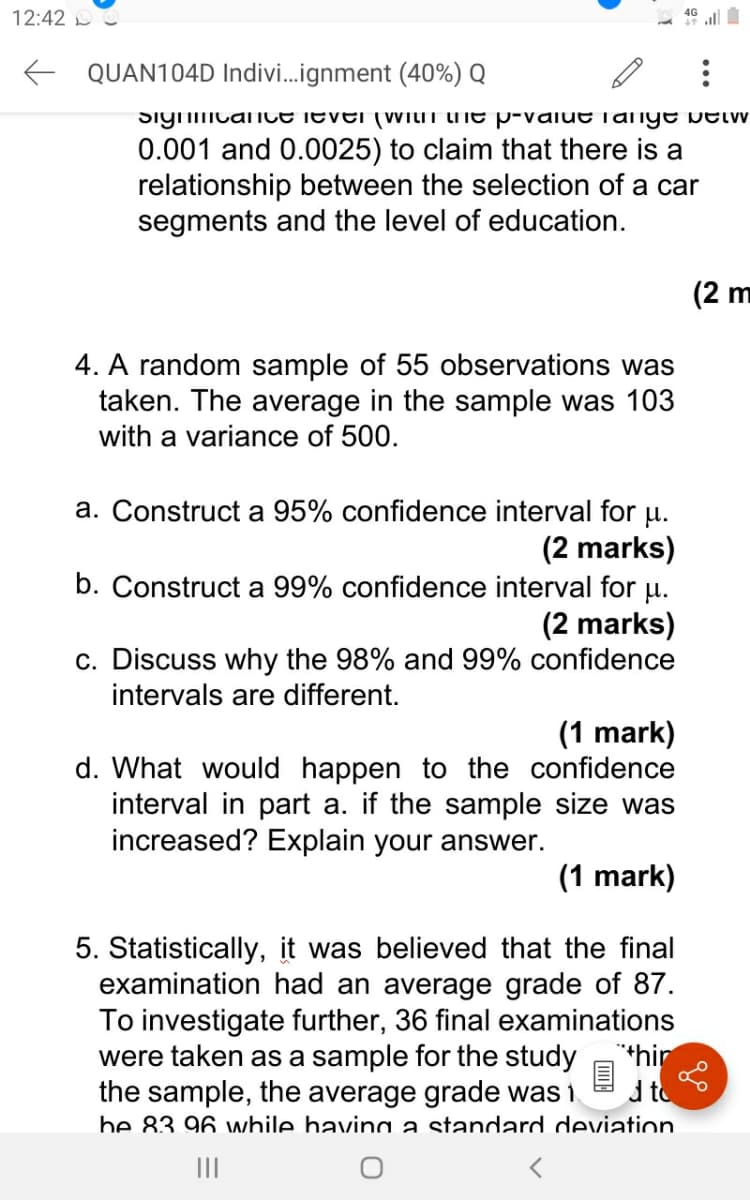
4. A random sample of 55 observations was taken. The average in the sample was 103 with a variance of 500.
a) Construct a 95% confidence interval for .
b) Construct a 99% confidence interval for .
c) Discuss why the 98% and 99% confidence intervals are different.
d) What would happen to the confidence interval in part a. If the sample size was increased? Explain your answer?
Transcribed Image Text:12:42
4G
E QUAN104D Indivi..ignment (40%) Q
SiyNicaCE IEVEI (VVILIT LTE p-value Talnye Detw
0.001 and 0.0025) to claim that there is a
relationship between the selection of a car
segments and the level of education.
(2 m
4. A random sample of 55 observations was
taken. The average in the sample was 103
with a variance of 500.
a. Construct a 95% confidence interval for u.
(2 marks)
b. Construct a 99% confidence interval for u.
(2 marks)
c. Discuss why the 98% and 99% confidence
intervals are different.
(1 mark)
d. What would happen to the confidence
interval in part a. if the sample size was
increased? Explain your answer.
(1 mark)
5. Statistically, it was believed that the final
examination had an average grade of 87.
To investigate further, 36 final examinations
were taken as a sample for the study
the sample, the average grade was i
be 83 96 wwhile havina a standard deviation
**hir
d to
II
Expert Solution
This question has been solved!
Explore an expertly crafted, step-by-step solution for a thorough understanding of key concepts.

This is a popular solution!

Trending now
This is a popular solution!

Step by step
Solved in 2 steps

Knowledge Booster


Learn more about
Need a deep-dive on the concept behind this application? Look no further. Learn more about this topic, statistics and related others by exploring similar questions and additional content below.Recommended textbooks for you
MATLAB: An Introduction with Applications
Statistics
ISBN:
9781119256830
Author:
Amos Gilat
Publisher:
John Wiley & Sons Inc

Probability and Statistics for Engineering and th…
Statistics
ISBN:
9781305251809
Author:
Jay L. Devore
Publisher:
Cengage Learning

Statistics for The Behavioral Sciences (MindTap C…
Statistics
ISBN:
9781305504912
Author:
Frederick J Gravetter, Larry B. Wallnau
Publisher:
Cengage Learning
MATLAB: An Introduction with Applications
Statistics
ISBN:
9781119256830
Author:
Amos Gilat
Publisher:
John Wiley & Sons Inc
Probability and Statistics for Engineering and th…
Statistics
ISBN:
9781305251809
Author:
Jay L. Devore
Publisher:
Cengage Learning
Statistics for The Behavioral Sciences (MindTap C…
Statistics
ISBN:
9781305504912
Author:
Frederick J Gravetter, Larry B. Wallnau
Publisher:
Cengage Learning

Elementary Statistics: Picturing the World (7th E…
Statistics
ISBN:
9780134683416
Author:
Ron Larson, Betsy Farber
Publisher:
PEARSON

The Basic Practice of Statistics
Statistics
ISBN:
9781319042578
Author:
David S. Moore, William I. Notz, Michael A. Fligner
Publisher:
W. H. Freeman

Introduction to the Practice of Statistics
Statistics
ISBN:
9781319013387
Author:
David S. Moore, George P. McCabe, Bruce A. Craig
Publisher:
W. H. Freeman