A random sample of n = 16 winter days in Denver gave a sample mean pollution index x, - 43. Previous studies show that e, = 14. For Englewood (a suburb of Denver), a random sample of ng - 13 winter days gave a sample mean pollution index of x, - 50. Previous studies show that az = 17. Assume the pollution index is normally distributed in both Englewood and Denver. Do these data indicate that the mean population pollution index of Englewood is different (either way) from that of Denver in the winter? Use a 1% level of significance. (a) What is the level of significance? State the null and alternate hypotheses. (b) What sampling distribution will you use? What assumptions are you making? O The standard normal. We assume that both population distributions are approximately normal with unknown standard deviations. O The Student's t. We assume that both population distributions are approximately normal with unknown standard deviations. O The standard normal. We assume that both population distributions are approximately normal with known standard deviations. O The Student's t. We assume that both population distributions are approximately normal with known standard deviations. What is the value of the sample test statistic? (Test the difference , - #z. Round your answer to two decimal places.) (c) Find (or estimate) the P-value. (Round your answer to four decimal places.)
A random sample of n = 16 winter days in Denver gave a sample mean pollution index x, - 43. Previous studies show that e, = 14. For Englewood (a suburb of Denver), a random sample of ng - 13 winter days gave a sample mean pollution index of x, - 50. Previous studies show that az = 17. Assume the pollution index is normally distributed in both Englewood and Denver. Do these data indicate that the mean population pollution index of Englewood is different (either way) from that of Denver in the winter? Use a 1% level of significance. (a) What is the level of significance? State the null and alternate hypotheses. (b) What sampling distribution will you use? What assumptions are you making? O The standard normal. We assume that both population distributions are approximately normal with unknown standard deviations. O The Student's t. We assume that both population distributions are approximately normal with unknown standard deviations. O The standard normal. We assume that both population distributions are approximately normal with known standard deviations. O The Student's t. We assume that both population distributions are approximately normal with known standard deviations. What is the value of the sample test statistic? (Test the difference , - #z. Round your answer to two decimal places.) (c) Find (or estimate) the P-value. (Round your answer to four decimal places.)

MATLAB: An Introduction with Applications
6th Edition
ISBN:9781119256830
Author:Amos Gilat
Publisher:Amos Gilat
Chapter1: Starting With Matlab
Section: Chapter Questions
Problem 1P

Related questions
Question
Hi can you fill out the blanks for me?
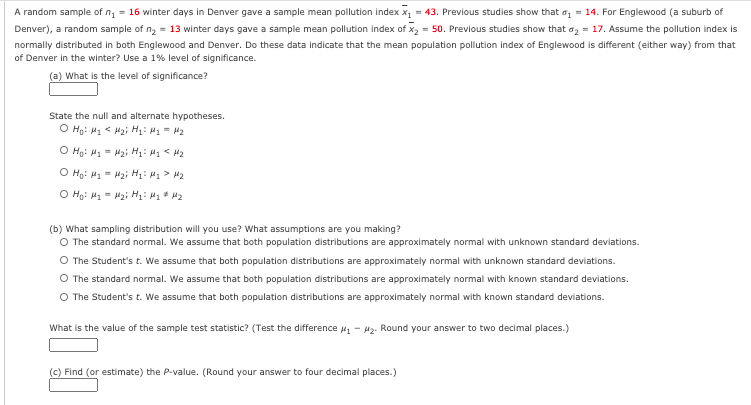
Transcribed Image Text:A random sample of n, = 16 winter days in Denver gave a sample mean pollution index x, = 43. Previous studies show that a, = 14. For Englewood (a suburb of
Denver), a random sample of ng = 13 winter days gave a sample mean pollution index of x, = 50. Previous studies show that o, = 17. Assume the pollution index is
normally distributed in both Englewood and Denver. Do these data indicate that the mean population pollution index of Englewood is different (either way) from that
of Denver in the winter? Use a 1% level of significance.
(a) What is the level of significance?
State the null and alternate hypotheses.
O Hạ: H1 = H2i H: M1 < H2
O Họ: H1 = H2i H: My > H2
O Họ: H - H2i H: H1 * M2
(b) What sampling distribution will you use? What assumptions are you making?
The standard normal. We assume that both population distributions are approximately normal with unknown standard deviations.
The Student's t. We assume that both population distributions are approximately normal with unknown standard deviations.
The standard normal. We assume that both population distributions are approximately normal with known standard deviations.
O The Student's t. We assume that both population distributions are approximately normal with known standard deviations.
What is the value of the sample test statistic? (Test the difference 41 - 42. Round your answer to two decimal places.)
(c) Find (or estimate) the P-value. (Round your answer to four decimal places.)
Expert Solution
This question has been solved!
Explore an expertly crafted, step-by-step solution for a thorough understanding of key concepts.

Step by step
Solved in 2 steps

Knowledge Booster


Learn more about
Need a deep-dive on the concept behind this application? Look no further. Learn more about this topic, statistics and related others by exploring similar questions and additional content below.Recommended textbooks for you
MATLAB: An Introduction with Applications
Statistics
ISBN:
9781119256830
Author:
Amos Gilat
Publisher:
John Wiley & Sons Inc

Probability and Statistics for Engineering and th…
Statistics
ISBN:
9781305251809
Author:
Jay L. Devore
Publisher:
Cengage Learning

Statistics for The Behavioral Sciences (MindTap C…
Statistics
ISBN:
9781305504912
Author:
Frederick J Gravetter, Larry B. Wallnau
Publisher:
Cengage Learning
MATLAB: An Introduction with Applications
Statistics
ISBN:
9781119256830
Author:
Amos Gilat
Publisher:
John Wiley & Sons Inc
Probability and Statistics for Engineering and th…
Statistics
ISBN:
9781305251809
Author:
Jay L. Devore
Publisher:
Cengage Learning
Statistics for The Behavioral Sciences (MindTap C…
Statistics
ISBN:
9781305504912
Author:
Frederick J Gravetter, Larry B. Wallnau
Publisher:
Cengage Learning

Elementary Statistics: Picturing the World (7th E…
Statistics
ISBN:
9780134683416
Author:
Ron Larson, Betsy Farber
Publisher:
PEARSON

The Basic Practice of Statistics
Statistics
ISBN:
9781319042578
Author:
David S. Moore, William I. Notz, Michael A. Fligner
Publisher:
W. H. Freeman

Introduction to the Practice of Statistics
Statistics
ISBN:
9781319013387
Author:
David S. Moore, George P. McCabe, Bruce A. Craig
Publisher:
W. H. Freeman