A real estate developer wishes to study the relationship between the size of home a client will purchase (in square feet) and other variables. Possible independent variables include the family income, family size, whether there is a senior adult parent living with the family (1 for yes, O for no), and the total years of education beyond high school for the husband and wife. The sample information is reported below. Senior Square Feet Income Family Family (000s) Size Parent Education 4. 60.8 68.4 2 2,240 2,300 3,400 3,360 3,000 2,900 4,100 2,520 4,200 2,800 2 1 3. 104.5 3 4 89.3 4 72.2 4. 114 10 7 125.4 8 83.6 3 9. 133 10 95 3. Click here for the Excel Data File a. Develop an appropriate multiple regression equation using stepwise regression. (Use Excel data analysis and enter number of family members first, then their income and delete any insignificant variables. Leave no cells blank - be certain to enter "O" wherever required. RandR adj are in percent values. Round your answers to 3 decimal places.) Step Constant Family Size t-statistic p-value Income t-statistic p-value R-Sq R-Sq(adj) 6792Oo coND
A real estate developer wishes to study the relationship between the size of home a client will purchase (in square feet) and other variables. Possible independent variables include the family income, family size, whether there is a senior adult parent living with the family (1 for yes, O for no), and the total years of education beyond high school for the husband and wife. The sample information is reported below. Senior Square Feet Income Family Family (000s) Size Parent Education 4. 60.8 68.4 2 2,240 2,300 3,400 3,360 3,000 2,900 4,100 2,520 4,200 2,800 2 1 3. 104.5 3 4 89.3 4 72.2 4. 114 10 7 125.4 8 83.6 3 9. 133 10 95 3. Click here for the Excel Data File a. Develop an appropriate multiple regression equation using stepwise regression. (Use Excel data analysis and enter number of family members first, then their income and delete any insignificant variables. Leave no cells blank - be certain to enter "O" wherever required. RandR adj are in percent values. Round your answers to 3 decimal places.) Step Constant Family Size t-statistic p-value Income t-statistic p-value R-Sq R-Sq(adj) 6792Oo coND

Glencoe Algebra 1, Student Edition, 9780079039897, 0079039898, 2018
18th Edition
ISBN:9780079039897
Author:Carter
Publisher:Carter
Chapter10: Statistics
Section10.3: Measures Of Spread
Problem 1GP

Related questions
Question
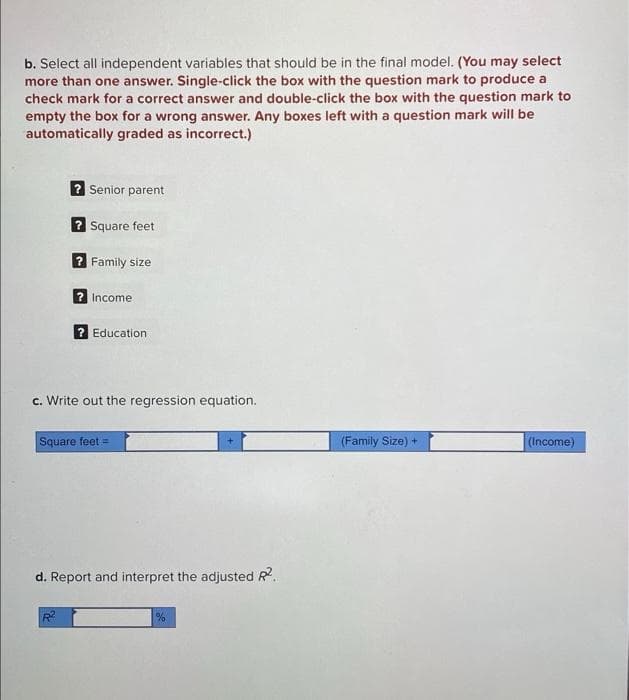
Transcribed Image Text:b. Select all independent variables that should be in the final model. (You may select
more than one answer. Single-click the box with the question mark to produce a
check mark for a correct answer and double-click the box with the question mark to
empty the box for a wrong answer. Any boxes left with a question mark will be
automatically graded as incorrect.)
Senior parent
? Square feet
2 Family size
? Income
? Education
c. Write out the regression equation.
Square feet =
(Family Size) +
(Income)
d. Report and interpret the adjusted R.
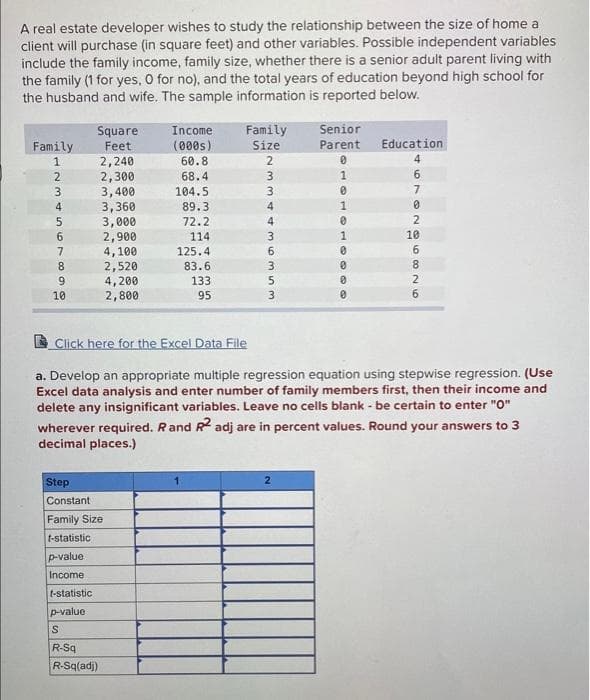
Transcribed Image Text:A real estate developer wishes to study the relationship between the size of home a
client will purchase (in square feet) and other variables. Possible independent variables
include the family income, family size, whether there is a senior adult parent living with
the family (1 for yes, O for no), and the total years of education beyond high school for
the husband and wife. The sample information is reported below.
Family
Senior
Square
Feet
Income
Family
Parent
Education
(000s)
60.8
68.4
Size
2
4.
2,240
2,300
3,400
3,360
3,000
2,900
2
1
6
3.
104.5
3
4
89.3
4
72.2
4.
2
114
10
6.
4,100
2,520
4,200
2,800
7
125.4
8
83.6
8.
9.
133
2
10
95
3.
6.
Click here for the Excel Data File
a. Develop an appropriate multiple regression equation using stepwise regression. (Use
Excel data analysis and enter number of family members first, then their income and
delete any insignificant variables. Leave no cells blank - be certain to enter "O"
wherever required. R andR adj are in percent values. Round your answers to 3
decimal places.)
Step
Constant
Family Size
t-statistic
p-value
Income
t-statistic
p-value
R-Sq
R-Sq(adj)
Expert Solution
This question has been solved!
Explore an expertly crafted, step-by-step solution for a thorough understanding of key concepts.

This is a popular solution!

Trending now
This is a popular solution!

Step by step
Solved in 5 steps with 5 images

Recommended textbooks for you
Glencoe Algebra 1, Student Edition, 9780079039897…
Algebra
ISBN:
9780079039897
Author:
Carter
Publisher:
McGraw Hill

College Algebra (MindTap Course List)
Algebra
ISBN:
9781305652231
Author:
R. David Gustafson, Jeff Hughes
Publisher:
Cengage Learning
Glencoe Algebra 1, Student Edition, 9780079039897…
Algebra
ISBN:
9780079039897
Author:
Carter
Publisher:
McGraw Hill
College Algebra (MindTap Course List)
Algebra
ISBN:
9781305652231
Author:
R. David Gustafson, Jeff Hughes
Publisher:
Cengage Learning