A realtor estimates that a certain new house worth $500,000 will gain value at a rate of 6% per year. Make a table that shows the worth of the house for years 0, 1, 2, 3, and 4. What is the real-world meaning of year 0? Which type of model best represents the data in your table? Explain. Write a function for the data. Year Value ($) 500, 000 530, 000 O A. 2 560, 000 590, 000 4 620, 000 Year O is the year when the house is new. The model that best represents the data in the table is exponential because value increases at an exponential rate. A function for the data is Y = 1.06x+500,000 Year Value ($) 500,000 1 470,000 B. 2 441,800 415,292 4 390, 374.48 Year O is the year when the house is new. The model that best represents the data in the table is exponential because value increases at an exponential rate. A function for the data is y = 500,000(1.06)*. 3. Year Value ($) 500, 000 1 530, 000 c. 2 560, 000 3 590, 000 4 620, 000 Year O is the year when the house is new. The model that best represents the data in the table is exponential because value increases at an exponential rate. A function for the data is y = 500, 000(1.06)*. Year Value ($) 500,000 1 530,000 D. 2 561,800 3 595,508 4 631, 238.48 Year O is the year when the house is new. The model that best represents the data in the table is exponential because value increases at an exponential rate. A function for the data is y = 500,000(1.06)*.
A realtor estimates that a certain new house worth $500,000 will gain value at a rate of 6% per year. Make a table that shows the worth of the house for years 0, 1, 2, 3, and 4. What is the real-world meaning of year 0? Which type of model best represents the data in your table? Explain. Write a function for the data. Year Value ($) 500, 000 530, 000 O A. 2 560, 000 590, 000 4 620, 000 Year O is the year when the house is new. The model that best represents the data in the table is exponential because value increases at an exponential rate. A function for the data is Y = 1.06x+500,000 Year Value ($) 500,000 1 470,000 B. 2 441,800 415,292 4 390, 374.48 Year O is the year when the house is new. The model that best represents the data in the table is exponential because value increases at an exponential rate. A function for the data is y = 500,000(1.06)*. 3. Year Value ($) 500, 000 1 530, 000 c. 2 560, 000 3 590, 000 4 620, 000 Year O is the year when the house is new. The model that best represents the data in the table is exponential because value increases at an exponential rate. A function for the data is y = 500, 000(1.06)*. Year Value ($) 500,000 1 530,000 D. 2 561,800 3 595,508 4 631, 238.48 Year O is the year when the house is new. The model that best represents the data in the table is exponential because value increases at an exponential rate. A function for the data is y = 500,000(1.06)*.

Glencoe Algebra 1, Student Edition, 9780079039897, 0079039898, 2018
18th Edition
ISBN:9780079039897
Author:Carter
Publisher:Carter
Chapter9: Quadratic Functions And Equations
Section9.8: Analyzing Functions With Successive Differences
Problem 29PPS

Related questions
Question
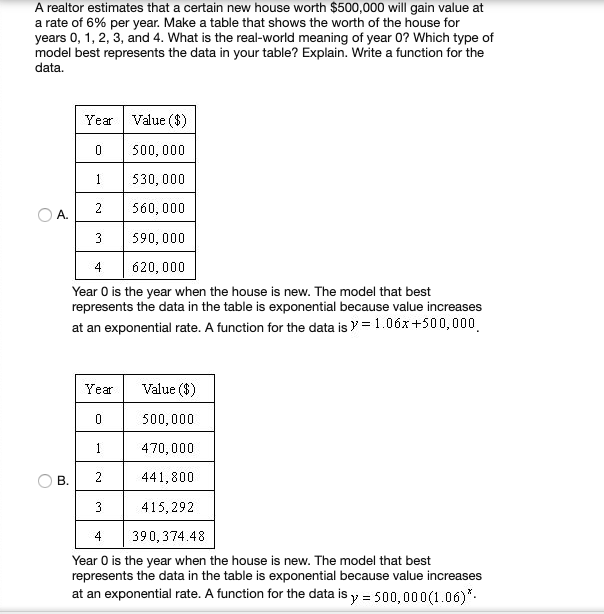
Transcribed Image Text:A realtor estimates that a certain new house worth $500,000 will gain value at
a rate of 6% per year. Make a table that shows the worth of the house for
years 0, 1, 2, 3, and 4. What is the real-world meaning of year 0? Which type of
model best represents the data in your table? Explain. Write a function for the
data.
Year
Value ($)
500, 000
530, 000
O A.
2
560, 000
590, 000
4
620, 000
Year O is the year when the house is new. The model that best
represents the data in the table is exponential because value increases
at an exponential rate. A function for the data is Y = 1.06x+500,000
Year
Value ($)
500,000
1
470,000
B.
2
441,800
415,292
4
390, 374.48
Year O is the year when the house is new. The model that best
represents the data in the table is exponential because value increases
at an exponential rate. A function for the data is y = 500,000(1.06)*.
3.
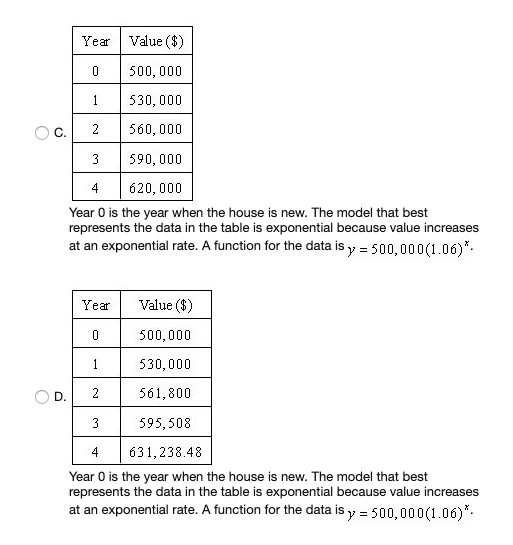
Transcribed Image Text:Year
Value ($)
500, 000
1
530, 000
c.
2
560, 000
3
590, 000
4
620, 000
Year O is the year when the house is new. The model that best
represents the data in the table is exponential because value increases
at an exponential rate. A function for the data is y = 500, 000(1.06)*.
Year
Value ($)
500,000
1
530,000
D.
2
561,800
3
595,508
4
631, 238.48
Year O is the year when the house is new. The model that best
represents the data in the table is exponential because value increases
at an exponential rate. A function for the data is y =
500,000(1.06)*.
Expert Solution
This question has been solved!
Explore an expertly crafted, step-by-step solution for a thorough understanding of key concepts.

This is a popular solution!

Trending now
This is a popular solution!

Step by step
Solved in 2 steps with 4 images

Recommended textbooks for you
Glencoe Algebra 1, Student Edition, 9780079039897…
Algebra
ISBN:
9780079039897
Author:
Carter
Publisher:
McGraw Hill

Big Ideas Math A Bridge To Success Algebra 1: Stu…
Algebra
ISBN:
9781680331141
Author:
HOUGHTON MIFFLIN HARCOURT
Publisher:
Houghton Mifflin Harcourt

College Algebra (MindTap Course List)
Algebra
ISBN:
9781305652231
Author:
R. David Gustafson, Jeff Hughes
Publisher:
Cengage Learning
Glencoe Algebra 1, Student Edition, 9780079039897…
Algebra
ISBN:
9780079039897
Author:
Carter
Publisher:
McGraw Hill
Big Ideas Math A Bridge To Success Algebra 1: Stu…
Algebra
ISBN:
9781680331141
Author:
HOUGHTON MIFFLIN HARCOURT
Publisher:
Houghton Mifflin Harcourt
College Algebra (MindTap Course List)
Algebra
ISBN:
9781305652231
Author:
R. David Gustafson, Jeff Hughes
Publisher:
Cengage Learning

Holt Mcdougal Larson Pre-algebra: Student Edition…
Algebra
ISBN:
9780547587776
Author:
HOLT MCDOUGAL
Publisher:
HOLT MCDOUGAL

Algebra: Structure And Method, Book 1
Algebra
ISBN:
9780395977224
Author:
Richard G. Brown, Mary P. Dolciani, Robert H. Sorgenfrey, William L. Cole
Publisher:
McDougal Littell

Trigonometry (MindTap Course List)
Trigonometry
ISBN:
9781337278461
Author:
Ron Larson
Publisher:
Cengage Learning