A recent study claim that 45% of population of all college students preferred printed textbooks to electronics textbooks. Do you want to test this claim by serving a random sample for you for college students. Follow the steps below to construct a 90% confidence interval for the population proportion of our college students are before print a tax breaks to electronic textbooks.
A recent study claim that 45% of population of all college students preferred printed textbooks to electronics textbooks. Do you want to test this claim by serving a random sample for you for college students. Follow the steps below to construct a 90% confidence interval for the population proportion of our college students are before print a tax breaks to electronic textbooks.

MATLAB: An Introduction with Applications
6th Edition
ISBN:9781119256830
Author:Amos Gilat
Publisher:Amos Gilat
Chapter1: Starting With Matlab
Section: Chapter Questions
Problem 1P

Related questions
Question
A recent study claim that 45% of population of all college students preferred printed textbooks to electronics textbooks. Do you want to test this claim by serving a random sample for you for college students. Follow the steps below to construct a 90% confidence interval for the population proportion of our college students are before print a tax breaks to electronic textbooks.
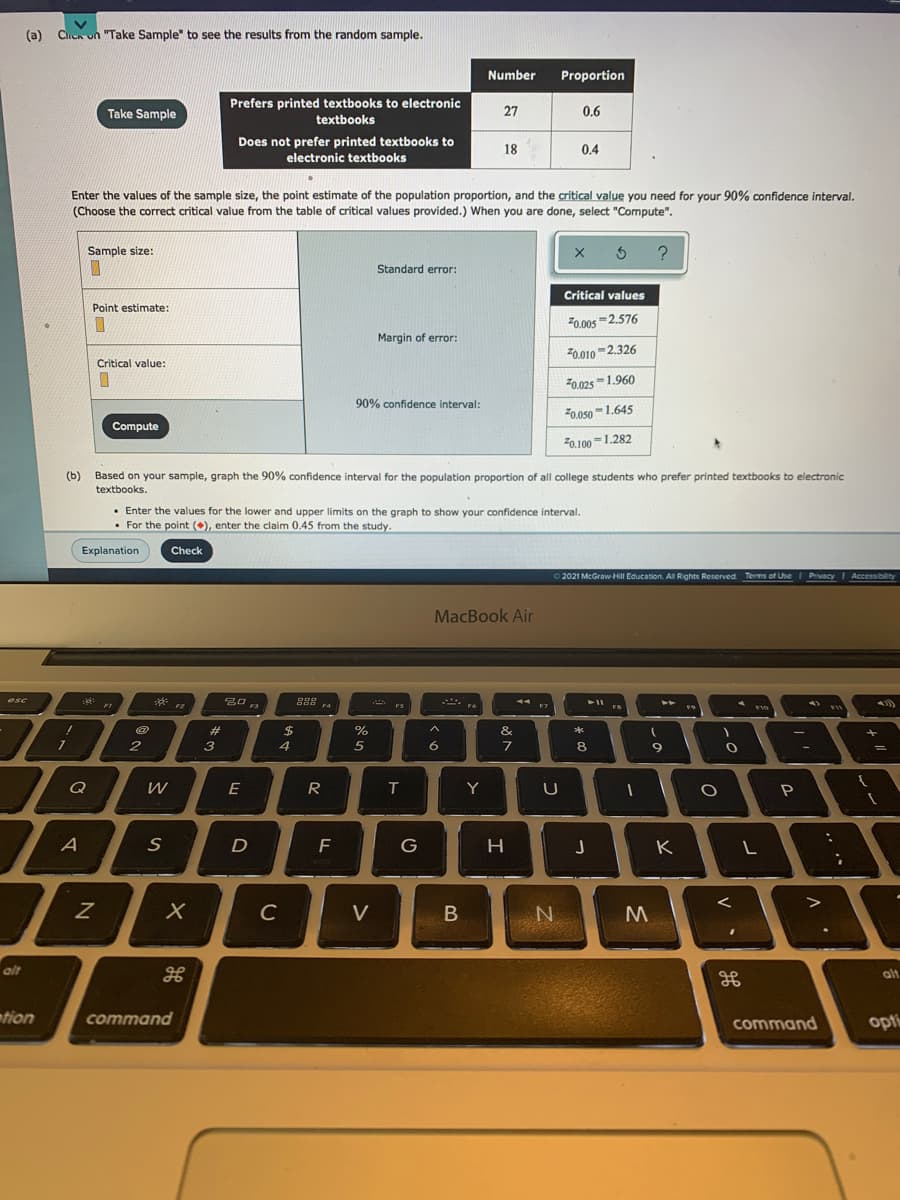
Transcribed Image Text:(a)
Cliek un "Take Sample" to see the results from the random sample.
Number
Proportion
Prefers printed textbooks to electronic
Take Sample
27
0.6
textbooks
Does not prefer printed textbooks to
18
0.4
electronic textbooks
Enter the values of the sample size, the point estimate of the population proportion, and the critical value you need for your 90% confidence interval.
(Choose the correct critical value from the table of critical values provided.) When you are done, select "Compute".
Sample size:
Standard error:
Critical values
Point estimate:
70.00s =2.576
Margin of error:
20.010 -2.326
Critical value:
F0.025 =1.960
90% confidence interval:
F0.050 -1.645
Compute
F0.100=1.282
(b)
Based on your sample, graph the 90% confidence interval for the population proportion of all college students who prefer printed textbooks to electronic
textbooks.
• Enter the values for the lower and upper limits on the graph to show your confidence interval.
For the point (), enter the claim 0.45 from the study.
Explanation
Check
© 2021 McGraw Hill Education. All Rights Reserved Terms of Use Privacy I Accessibilty
MacBook Air
esc
888 4
F7
%23
%
&
3
4
6.
8
Q
E
R
Y
P
A
D
G
J
K
C
V
alt
alt
tion
command
command
opti
.. **
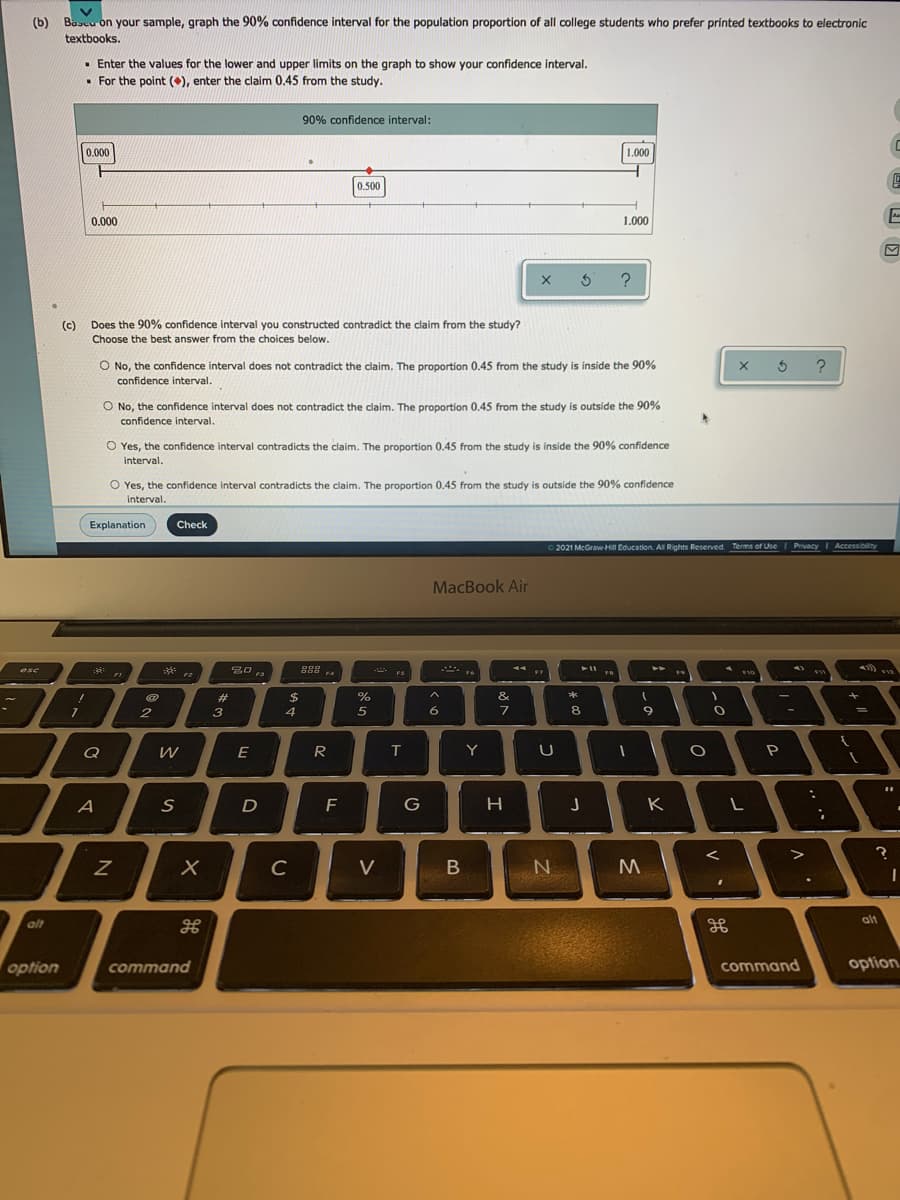
Transcribed Image Text:(b) Bascu on your sample, graph the 90% confidence interval for the population proportion of all college students who prefer printed textbooks to electronic
textbooks.
• Enter the values for the lower and upper limits on the graph to show your confidence interval.
• For the point (), enter the claim 0.45 from the study.
90% confidence interval:
0.000
1.000
0.500
0.000
1.000
?
(c) Does the 90% confidence interval you constructed contradict the claim from the study?
Choose the best answer from the choices below.
O No, the confidence interval does not contradict the claim. The proportion 0.45 from the study is inside the 90%
confidence interval.
O No, the confidence interval does not contradict the claim. The proportion 0.45 from the study is outside the 90%
confidence interval.
O Yes, the confidence interval contradicts the claim. The proportion 0.45 from the study is inside the 90% confidence
interval.
O Yes, the confidence interval contradicts the claim. The proportion 0.45 from the study is outside the 90% confidence
interval.
Explanation
Check
O2021 McGraw Hill Education, All Rights Reserved Terms of Use
I PrivacyI Accessbility
MacBook Air
esc
888
トI
トト
*
FA
FS
10
FI
FZ
%23
2$
&
*
4
7
8
Q
E
R.
T
Y
P
A
F
H.
J
K
C
V
B
alt
alt
option
command
command
option
しa
Expert Solution
This question has been solved!
Explore an expertly crafted, step-by-step solution for a thorough understanding of key concepts.

This is a popular solution!

Trending now
This is a popular solution!

Step by step
Solved in 2 steps with 2 images

Knowledge Booster


Learn more about
Need a deep-dive on the concept behind this application? Look no further. Learn more about this topic, statistics and related others by exploring similar questions and additional content below.Recommended textbooks for you
MATLAB: An Introduction with Applications
Statistics
ISBN:
9781119256830
Author:
Amos Gilat
Publisher:
John Wiley & Sons Inc

Probability and Statistics for Engineering and th…
Statistics
ISBN:
9781305251809
Author:
Jay L. Devore
Publisher:
Cengage Learning

Statistics for The Behavioral Sciences (MindTap C…
Statistics
ISBN:
9781305504912
Author:
Frederick J Gravetter, Larry B. Wallnau
Publisher:
Cengage Learning
MATLAB: An Introduction with Applications
Statistics
ISBN:
9781119256830
Author:
Amos Gilat
Publisher:
John Wiley & Sons Inc
Probability and Statistics for Engineering and th…
Statistics
ISBN:
9781305251809
Author:
Jay L. Devore
Publisher:
Cengage Learning
Statistics for The Behavioral Sciences (MindTap C…
Statistics
ISBN:
9781305504912
Author:
Frederick J Gravetter, Larry B. Wallnau
Publisher:
Cengage Learning

Elementary Statistics: Picturing the World (7th E…
Statistics
ISBN:
9780134683416
Author:
Ron Larson, Betsy Farber
Publisher:
PEARSON

The Basic Practice of Statistics
Statistics
ISBN:
9781319042578
Author:
David S. Moore, William I. Notz, Michael A. Fligner
Publisher:
W. H. Freeman

Introduction to the Practice of Statistics
Statistics
ISBN:
9781319013387
Author:
David S. Moore, George P. McCabe, Bruce A. Craig
Publisher:
W. H. Freeman