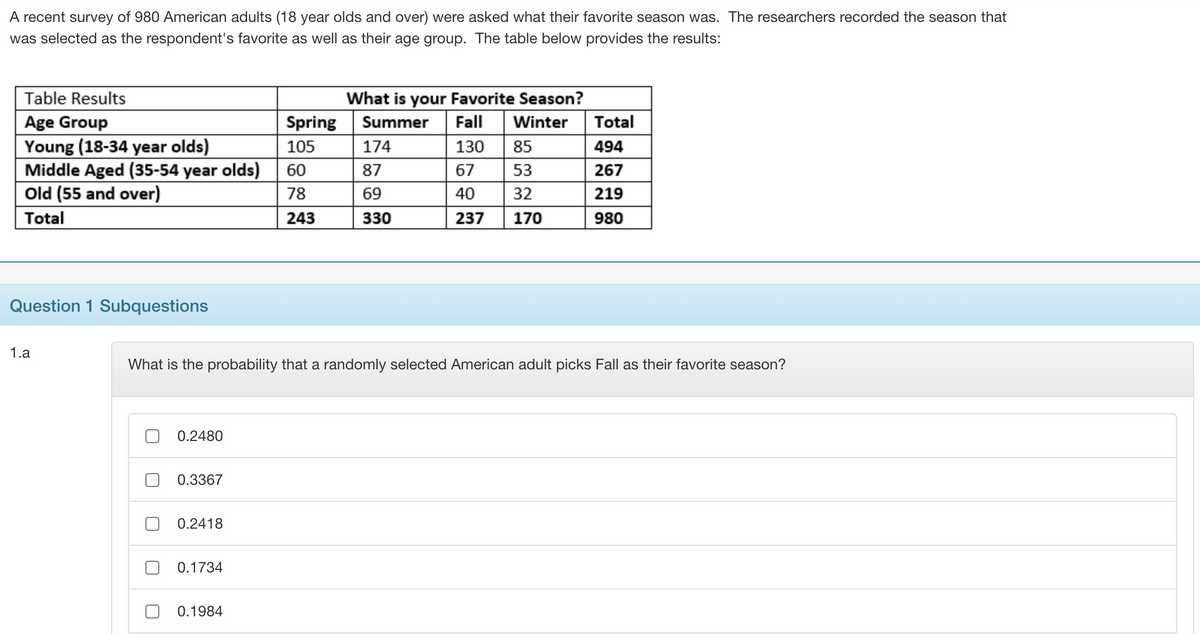
A recent survey of 980 American adults (18 year olds and over) were asked what their favorite season was. The researchers recorded the season that was selected as the respondent's favorite as well as their age group. The table below provides the results: Table Results What is your Favorite Season? Age Group Young (18-34 year olds) Middle Aged (35-54 year olds) Old (55 and over) Spring Summer Fall Winter Total 105 174 130 85 494 60 87 67 53 267 78 69 40 32 219 Total 243 330 237 170 980 Question 1 Subquestions 1.a What is the probability that a randomly selected American adult picks Fall as their favorite season? 0.2480 0.3367 0.2418 0.1734 0.1984
A recent survey of 980 American adults (18 year olds and over) were asked what their favorite season was. The researchers recorded the season that was selected as the respondent's favorite as well as their age group. The table below provides the results: Table Results What is your Favorite Season? Age Group Young (18-34 year olds) Middle Aged (35-54 year olds) Old (55 and over) Spring Summer Fall Winter Total 105 174 130 85 494 60 87 67 53 267 78 69 40 32 219 Total 243 330 237 170 980 Question 1 Subquestions 1.a What is the probability that a randomly selected American adult picks Fall as their favorite season? 0.2480 0.3367 0.2418 0.1734 0.1984

Glencoe Algebra 1, Student Edition, 9780079039897, 0079039898, 2018
18th Edition
ISBN:9780079039897
Author:Carter
Publisher:Carter
Chapter10: Statistics
Section10.6: Summarizing Categorical Data
Problem 10CYU

Related questions
Question
Read the following prompt and complete 1.a, 1.e, 1.f
Transcribed Image Text:1.e
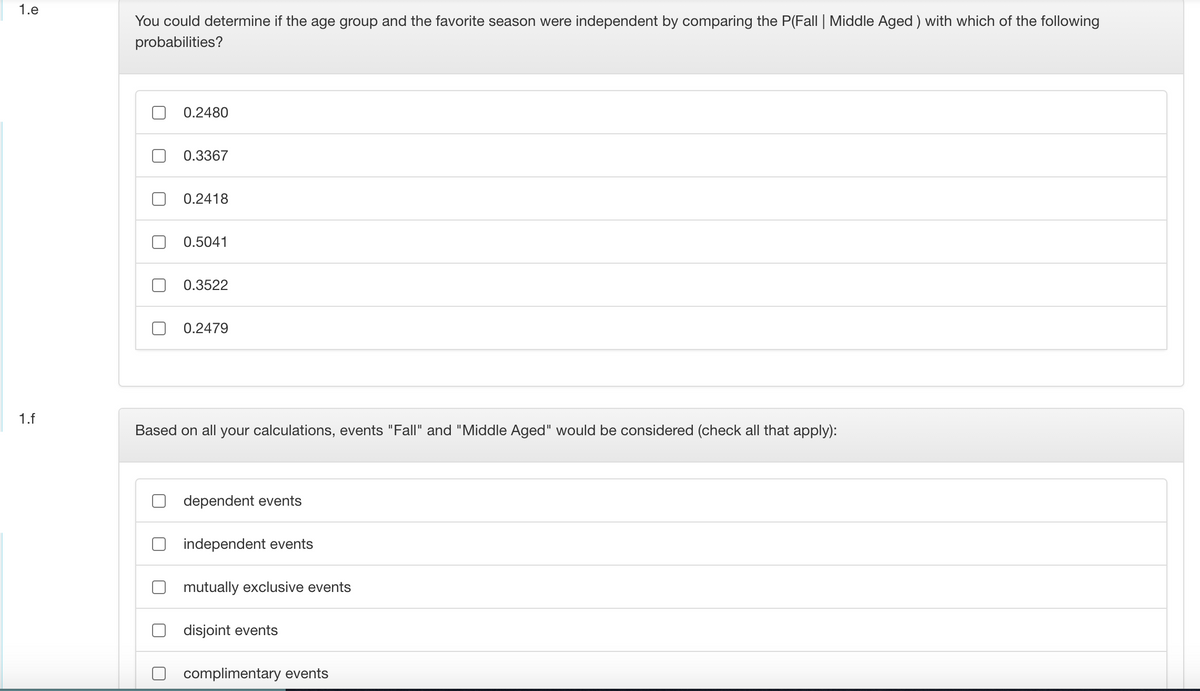
You could determine if the age group and the favorite season were independent by comparing the P(Fall | Middle Aged ) with which of the following
probabilities?
0.2480
0.3367
0.2418
0.5041
0.3522
0.2479
1.f
Based on all your calculations, events "Fall" and "Middle Aged" would be considered (check all that apply):
dependent events
independent events
mutually exclusive events
disjoint events
complimentary events
Transcribed Image Text:A recent survey of 980 American adults (18 year olds and over) were asked what their favorite season was. The researchers recorded the season that
was selected as the respondent's favorite as well as their age group. The table below provides the results:
Table Results
What is your Favorite Season?
Age Group
Spring
Summer
Fall
Winter
Total
Young (18-34 year olds)
Middle Aged (35-54 year olds) | 60
Old (55 and over)
105
174
130
85
494
87
67
53
267
78
69
40
32
219
Total
243
330
237
170
980
Question 1 Subquestions
1.a
What is the probability that a randomly selected American adult picks Fall as their favorite season?
0.2480
0.3367
0.2418
0.1734
0.1984
Expert Solution
This question has been solved!
Explore an expertly crafted, step-by-step solution for a thorough understanding of key concepts.

Step by step
Solved in 2 steps

Knowledge Booster


Learn more about
Need a deep-dive on the concept behind this application? Look no further. Learn more about this topic, statistics and related others by exploring similar questions and additional content below.Recommended textbooks for you
Glencoe Algebra 1, Student Edition, 9780079039897…
Algebra
ISBN:
9780079039897
Author:
Carter
Publisher:
McGraw Hill

Holt Mcdougal Larson Pre-algebra: Student Edition…
Algebra
ISBN:
9780547587776
Author:
HOLT MCDOUGAL
Publisher:
HOLT MCDOUGAL

Big Ideas Math A Bridge To Success Algebra 1: Stu…
Algebra
ISBN:
9781680331141
Author:
HOUGHTON MIFFLIN HARCOURT
Publisher:
Houghton Mifflin Harcourt
Glencoe Algebra 1, Student Edition, 9780079039897…
Algebra
ISBN:
9780079039897
Author:
Carter
Publisher:
McGraw Hill
Holt Mcdougal Larson Pre-algebra: Student Edition…
Algebra
ISBN:
9780547587776
Author:
HOLT MCDOUGAL
Publisher:
HOLT MCDOUGAL
Big Ideas Math A Bridge To Success Algebra 1: Stu…
Algebra
ISBN:
9781680331141
Author:
HOUGHTON MIFFLIN HARCOURT
Publisher:
Houghton Mifflin Harcourt