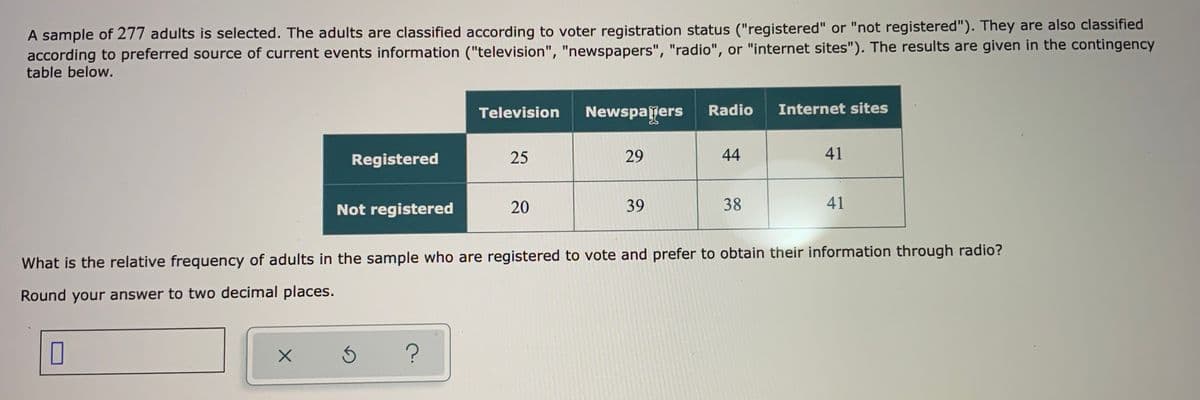
A sample of 277 adults is selected. The adults are classified according to voter registration status ("registered" or "not registered"). They are also classified according to preferred source of current events information ("television", "newspapers", "radio", or "internet sites"). The results are given in the contingency table below. Newspajers Radio Internet sites Television Registered 25 29 44 41 Not registered 39 38 41 What is the relative frequency of adults in the sample who are registered to vote and prefer to obtain their information through radio? Round your answer to two decimal places. 20
Q: A company producing LED bulbs finds that mean life span of the population of its bulbs is 2000 hours...
A:
Q: F oranges pineapples bananas apples pears V рeas carrots beans potatoes corn
A: Given: Venn diagram where F is subset of C and S is subset of F then S is subset of F and S is su...
Q: There are three math students (Ann, Kim and Billie) waiting for their turn to work with the math tut...
A:
Q: A bag contains 9 pennies, 6 nickels, and 5 dimes. If a coin is randomly selected from the bag, then ...
A: We have given that, A bag contains, Pennies = 9 Nickels = 6 Dimes = 5 Total = 9+6+5 = 20 Then, We...
Q: An experimenter conducted a two-tailed hypothesis test on a set of data and obtained a p-value of 0....
A: Given that The pvalue for two tailed test =0.44 We have to find the p value for one tailed test:
Q: Find the mean, median, mode, and midrange for the data. Comment
A: Here given data of earnings of nonliving celebrities
Q: fill in the blank spaces: when the ------------ standard deviation is----------------we need to cal...
A: Note that Student's t distribution is used when the poulation standard deviation is unknown and norm...
Q: A techhician is workKing ntal research laboratory. She has 100 soll The technician randomly picks a ...
A: We have given that, Total sample in laboratory = 100 The sample the technician picks does not conta...
Q: Given the following data, find the diameter that represents the 35th percentile. Diameters of Golf ...
A: Data in ascending order, 1.31 1.33 1.33 1.35 1.39 1.41 1.42 1.43 1.43 1.52 1.52 1.57 1.58 1.59 1.67
Q: From the 457 business graduates of a university, 404 graduates consider to work after they have comp...
A:
Q: 1. Residents in a barangay A and B responded to the same question regarding the controversial issue ...
A: Disclaimer : “Since you have posted a question with multiple sub-parts, we will solve first three s...
Q: 3. The table provides data associated with a study conducted at the Virginia Polytechnic Institute a...
A: The data of two samples of 10 northern red oak seedling are given where one sample was provide nitro...
Q: Ogive is a line graph. The frequency is placed along the vertical axis and the class midpoints are p...
A: We have given statement is "Ogive is a line graph. The frequency is placed along the vertical axis ...
Q: Property 3. If X is a random variable and ´a' is constant, then E [a ¥ (X)] = a E [Y (X)] E [Y (X) +...
A:
Q: A parenting magazine reports that the average amount of wireless data used by teenagers each month i...
A: State the null and alternative hypotheses for the test. Fill in the blank below. H0: μ=6: Ha:μ⎯⎯⎯⎯...
Q: Determine if the following statements are true or false, and explain your reasoning. If false, state...
A: Given that (a) Decreasing the significance level (α) will increase the probability of making a Type...
Q: Use the Standard Normal Table to find the z-score that corresponds to the cumulative area of 0.9854....
A:
Q: Which figure do you think logically belongs in the missing square? Select one: O a. +++
A: We see the sticks vertically then for vertical sticks yellow, blue and white colour are used in ever...
Q: The P-value for a two-sided test of the null hypothesis H0: μ = 10 is 0.03. (a) Does the 95% confide...
A: Given data Claim :mu=10 P value for two tailed test = 0.03 We reject Ho if pvalue < alpha
Q: Compute the rank correlation coefficient for the following data of the marks obtained by 8 students ...
A:
Q: A doctor has decided to prescribe two new drugs to 200 heart patients, as follows: 50 get drug A, 50...
A:
Q: Height of the fathers and sons are given below. Find the height or tne son when the height of father...
A: X :- 71, 68, 66, 67, 70, 71, 70, 73, 72, 65, 66 Y:- 69, 64, 65, 63, 65, 62, 65, 64, 66, 59, 62 Wher...
Q: 4. There is a significant difference between the proportion of male and the proportion of female emp...
A: Since you have asked multiple questions, we will solve the first question for you. If you want any s...
Q: The frequency distribution was obtained using a class width of 0.5 for data on cigarette tax rates. ...
A: Given , the frequency distribution, we need to find the population mean and population standard dev...
Q: SWilliam is pulling Cards from a s2-card deck ifne pulls tart accnd oat ondamy what s the likelihcod...
A:
Q: You just finished statistics class and are eager to collect and analyze your own data! You run out ...
A: Given that You just finished statistics class and are eager to collect and analyze your own data! Y...
Q: A variable is normally distributed with mean 6 and standard deviation 2. a. Find the percentage of ...
A: Let X be the random variable from normal distribution with mean (μ) = 6 and standard deviation (σ) =...
Q: . In a group of 800 students, the number of married is 320. But of 240 students who failed, 96 belon...
A:
Q: Which of the following is the tcritical value? 1.895 2.306 1.860 2.364 Which of the following is th...
A: To determine if there is a significant difference between the results of the two groups: Consider Ji...
Q: From past experience, the probability that a new worker in a company can complete his daily tasks sa...
A: Let us define some events A : the new worker undergoes the training. B : the new worker does not und...
Q: Example 6-3. In four tosses of a coin, let X be the number of heads. Tabulate the 16 possible outcom...
A:
Q: Find the quartiles of the Normal distribution having mean 60 and S.D 10.
A:
Q: College and University Debt A student graduated from a 4-year college debt is $8489 with a standard ...
A: formula for z-score is
Q: A large-sample 98 percent confidence interval for the proportion of hotel reservations that are canc...
A: Given,98% confidence interval is (0.048 , 0.112)
Q: Sr # Tempera (Number of Air (Degrees Conditio Outside Sales X(outsid Y(sales) X*2 Y*2 Y=-5 e ture te...
A: Given data depicts the outside temperature and the number of air conditioning units sold. A scatterp...
Q: The probability of any event occurring is between__________ and ,_________ inclusive.
A: Here use basic probability concept
Q: find z so that 95% of a standard normal curve lies to the right of z
A:
Q: Recently, a random sample of 25-34 year olds was asked, "How much do you currently have in savings, ...
A: Class frequency (f) Mid vaue (x) f.x f.x2 0-199 342 99.5 34029 3385885.5 200-399 86 299.5 25757...
Q: A random variable X has the probability density function is given by ke2,x20 S(x) = (1) find k (ii) ...
A:
Q: On a dry surface, the braking distance of a fully loaded tractor trailer is 370 ft with a standard d...
A: We have given that. X~N( μ , ?^2 ) μ=370 , ? =40 Z-score =( x - μ )/?
Q: Choose THREE of the following situations which illustrate a random variable. A. The time it takes to...
A: Disclaimer : "Since you have asked multiple question, we will solve the first question for you. If y...
Q: Sixty adults with gum disease were asked the number of times per week they used to floss before thei...
A: ( a ) Fill in the blanks in the table ( b ) p( x = 6 ) =% (c )P ( X < = 3 ) =?
Q: My internal width is 8, how can i solve for the class intervals? and please do solve this problem wi...
A: Number of times a variate value is repeated is called its frequency. The number of observations corr...
Q: Find the quartiles of the Normal distribution having mean 60 and S.D 10.
A:
Q: Two types of batteries are tested for their length of life (in hours). The following data is the sum...
A:
Q: a) The Table below shows the average score of the150 students sampled from the University of the Eas...
A: As per our guidelines we are suppose to answer only one questiona)Given data is score(out of 100)...
Q: Calculate the median and mode (by grouping method) from the following data: Central size : 15 25 35 ...
A: For a distribution, median is the middle most value. In other words, median is that value of the dis...
Q: Performance of students of X Standard in a national level talent search examination was studied. The...
A: The z test are used to measure the mean significance between the sample and population. If the sampl...
Q: You do NOT think that one predicts the other, you just wonder if they are related to each other. You...
A: We have to determine the most suitable procedure to know the relationship between two interval/ratio...
Q: During the COVID-19 pandemic, drive-up grocery delivery became very popular with customers. Two US r...
A: Disclaimer : “Since you have posted a question with multiple sub-parts, we will solve first three su...
Trending now
This is a popular solution!
Step by step
Solved in 2 steps with 1 images
- The director of the MBA program at Salterdine University wants to develop a procedure to determine which applicants to admit to the MBA program. The director believes that an applicant’s undergraduate grade point average (GPA) and score on the GMAT exam are helpful in predicting which applicants will be good students. To assist in this endeavor, the director asked a committee of faculty members to classify 70 of the recent students in the MBA program into two groups: (1) good students and (2) weak students. The file MBAStudents.xlsm summarizes these ratings, along with the GPA and GMAT scores for the 70 students. What are the coordinates of the centroids for the good students and the weak students? Use XLMiner’s standard data partition command to partition the data into a training set (with 60% of the observations) and validation set (with 40% of the observations) using the default seed of 12345. Use discriminant analysis to create a classifier for this data. How accurate is this…The number of people voting LAKAS or KAMPI below the age of 40 and 40 plus in a random sample of 30 voters in a city is given in contingency table below. Is voting LAKAS or KAMPI independent of the voter being below the age of 40 or 40 plus in this city at the 5% level of significance?According to the National Institute on Alcohol Abuse and Alcoholism (NIAAA) and the National Institutes of Health (NIH), 41% of college students nationwide engage in "binge-drinking" behavior: having five or more drinks on one occasion during the past two weeks. A college president wonders if the proportion of students enrolled at her college who binge drink is actually lower than the national proportion. In a commissioned study, 344 students are selected randomly from a list of all students enrolled at the college. Of these, 132 admit to having engaged in binge drinking.The college president is more interested in testing her belief that the proportion of students at her college who engage in binge drinking is lower than the national proportion of 0.41. What is the P-value? (Round your answer to four decimal places.)P-value = ?
- ClairLinx Wireless, a start-up cell phone company, has divided its market of potential customers into three major groups: single, working; married, working; and retired. ClairLinx surveyed 500 potential customers and asked each, "Of the following, which do you consider to be the most important feature in a cell phone service plan: free nights and weekends, free long distance and roaming, or free calls to customers with the same company?" Each of the 500 potential customers in the survey was categorized according to the service plan feature she considers most important and the customer group in which she appears. The data are summarized in the contingency table below. In the cells of the table are the respective observed frequencies, and three of the cells also have blanks. Fill in these blanks with the frequencies expected if the two variables, type of potential customer and choice of service plan feature, are independent. Round the responses to at least two decimal places. Note:…To better understand how husbands and wives feel about their finances, Mo11ey Magazi11e conducted a national poll of 1010 married adults age 25 and older with household incomes of $50,000 or more (1\!1011ey Magazi11ewebsite, December 14, 2014). Consider the following example set of responses to the question, "Who is better at getting deals?" Who is better Respondent I am My Spouse We are equal Husband 278 127 102 Wife 290 111 102 a. Develop a joint probability table and use it to answer the following questions. b. Construct the marginal probabilities for Who Isbetter (I Am, My Spouse, We Are Equal). c. Given that the respondent is a husband, what is the probability that he feels he is better at getting deals than his wife? d. Given that the respondent is a wife, what is the probability that she feels she is better at getting deals than her husband? e. Given a response "My…The U.S. Census Bureau conducts annual surveys to obtain information on the percentage of the voting-age population that is registered to vote. Suppose that 679679 employed persons and 690690 unemployed persons are independently and randomly selected, and that 429429 of the employed persons and 369369 of the unemployed persons have registered to vote. Can we conclude that the percentage of employed workers ( p1p1 ), who have registered to vote, exceeds the percentage of unemployed workers ( p2p2 ), who have registered to vote? Use a significance level of α=0.05α=0.05 for the test. Step 1 of 6 : State the null and alternative hypotheses for the test.
- The U.S. Census Bureau conducts annual surveys to obtain information on the percentage of the voting-age population that is registered to vote. Suppose that 679679 employed persons and 690690 unemployed persons are independently and randomly selected, and that 429429 of the employed persons and 369369 of the unemployed persons have registered to vote. Can we conclude that the percentage of employed workers ( p1p1 ), who have registered to vote, exceeds the percentage of unemployed workers ( p2p2 ), who have registered to vote? Use a significance level of α=0.05α=0.05 for the test. Step 6 of 6 : Make the decision for the hypothesis test.The U.S. Census Bureau conducts annual surveys to obtain information on the percentage of the voting-age population that is registered to vote. Suppose that 679679 employed persons and 690690 unemployed persons are independently and randomly selected, and that 429429 of the employed persons and 369369 of the unemployed persons have registered to vote. Can we conclude that the percentage of employed workers ( p1p1 ), who have registered to vote, exceeds the percentage of unemployed workers ( p2p2 ), who have registered to vote? Use a significance level of α=0.05α=0.05 for the test. Step 2 of 6 : Find the values of the two sample proportions, pˆ1p^1 and pˆ2p^2. Round your answers to three decimal places.The U.S. Census Bureau conducts annual surveys to obtain information on the percentage of the voting-age population that is registered to vote. Suppose that 679679 employed persons and 690690 unemployed persons are independently and randomly selected, and that 429429 of the employed persons and 369369 of the unemployed persons have registered to vote. Can we conclude that the percentage of employed workers ( p1p1 ), who have registered to vote, exceeds the percentage of unemployed workers ( p2p2 ), who have registered to vote? Use a significance level of α=0.05α=0.05 for the test. Step 3 of 6 : Compute the weighted estimate of p, p‾‾p‾. Round your answer to three decimal places.
- The U.S. Census Bureau conducts annual surveys to obtain information on the percentage of the voting-age population that is registered to vote. Suppose that 679679 employed persons and 690690 unemployed persons are independently and randomly selected, and that 429429 of the employed persons and 369369 of the unemployed persons have registered to vote. Can we conclude that the percentage of employed workers ( p1p1 ), who have registered to vote, exceeds the percentage of unemployed workers ( p2p2 ), who have registered to vote? Use a significance level of α=0.05α=0.05 for the test. Step 4 of 6 : Compute the value of the test statistic. Round your answer to two decimal places.A highway agent sampled cars going from one state to a neighboring state. In his report, he indicated that of the 80 cars sampled, 32 cars were driven by women, 55 cars were sport-utility vehicles, 43 cars had two or more passengers, 26 cars were driven by women in sport-utility vehicles, 26 cars were driven by women and had two or more passengers, 21 cars were sport-utility vehicles and had two or more passengers, and 16 cars were driven by women in sport-utility vehicles and had two or more passengers. After his supervisor reads the report, she explains to the agent that he made a mistake. Explain how his supervisor knew that the agent's report contained an error. Select the correct choice below and fill in the answer box to complete your choice. (Type a whole number.) A. The agent's first three statements indicate that at least enter your response here cars were driven by women in sport-utility vehicles and had two or more passengers. This contradicts…A highway agent sampled cars going from one state to a neighboring state. In his report, he indicated that of the 78 cars sampled, 27 cars were driven by women, 53 cars were sport-utility vehicles, 37 cars had two or more passengers, 24 cars were driven by women in sport-utility vehicles, 21 cars were driven by women and had two or more passengers, 18 cars were sport-utility vehicles and had two or more passengers, and 13 cars were driven by women in sport-utility vehicles and had two or more passengers. After his supervisor reads the report, she explains to the agent that he made a mistake. A. The agent's last four statements indicate that at least _________ cars were driven by women. This contradicts the agent's first statement, which says that only 27 such cars were seen. B. The agent's last four statements indicate that at least ______ cars were sport-utility vehicles. This contradicts the agent's second statement, which says that only 53 such cars were…