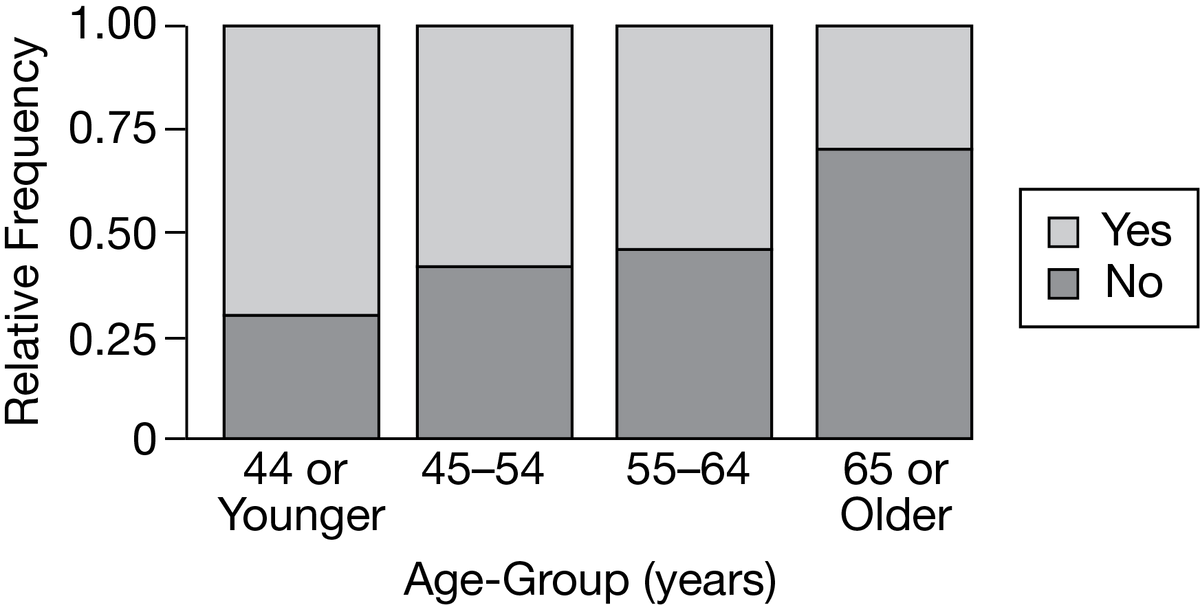
A recent survey of wheat growers focused on the characteristics of wheat farmers and their willingness to participate in agricultural research. One of the variables of interest in the survey was the age of the farmer. The following bar chart shows the responses of the farmers, classified by age-group, regarding their willingness to participate. Which of the following statements is supported by the bar chart? I am choosing betwwen a positive association between the age of the farmers and their willingness to participate and a negative association between the age of the farms and their willingness to participate.


A recent survey of wheat growers focused on the characteristics of wheat farmers and their willingness to participate in agricultural research. One of the variables of interest in the survey was the age of the farmer. The following bar chart shows the responses of the farmers, classified by age-group, regarding their willingness to participate.
Which of the following statements is supported by the bar chart?
I am choosing betwwen a positive association between the age of the farmers and their willingness to participate and a negative association between the age of the farms and their willingness to participate. I think it is a negative association because if we are talking about willingness the that mean they would say yes to participation, which means that the slope would be negative, but I am unsure.


Trending now
This is a popular solution!

Step by step
Solved in 2 steps


