A regression model relating x, number of salespersons at a branch office, to y, annual sales at the office (in thousands of dollars) provided the following regression output. Where motal = 40. ANOVA df MS F Significance F Regression 7,085.8 Residual Total 9,724.5 Coefficients Standard Error t Stat P-value Intercept 90.0 12.187 Number of 54.0 5.958 Salespersons a. Write the estimated regression equation (to whole number). b. Compute the F statistic and test the significance of the relationship at a 0.05 level of significance. (to 2 decimals) F-value p-value is Select your answer - we - Select your answer - v Ho c. Compute the t statistic and test the significance of the relationship at a 0.05 level of significance. (to 2 decimals) t Stat p-value is - Select your answer - , we Select your answer v Ho : B1 = d. Predict the annual sales at the Memphis branch office. This branch employs 12 salespersons.
A regression model relating x, number of salespersons at a branch office, to y, annual sales at the office (in thousands of dollars) provided the following regression output. Where motal = 40. ANOVA df MS F Significance F Regression 7,085.8 Residual Total 9,724.5 Coefficients Standard Error t Stat P-value Intercept 90.0 12.187 Number of 54.0 5.958 Salespersons a. Write the estimated regression equation (to whole number). b. Compute the F statistic and test the significance of the relationship at a 0.05 level of significance. (to 2 decimals) F-value p-value is Select your answer - we - Select your answer - v Ho c. Compute the t statistic and test the significance of the relationship at a 0.05 level of significance. (to 2 decimals) t Stat p-value is - Select your answer - , we Select your answer v Ho : B1 = d. Predict the annual sales at the Memphis branch office. This branch employs 12 salespersons.

Trigonometry (MindTap Course List)
8th Edition
ISBN:9781305652224
Author:Charles P. McKeague, Mark D. Turner
Publisher:Charles P. McKeague, Mark D. Turner
Chapter4: Graphing And Inverse Functions
Section: Chapter Questions
Problem 6GP: If your graphing calculator is capable of computing a least-squares sinusoidal regression model, use...

Related questions
Question
A regression model relating , number of salespersons at a branch office, to , annual sales at the office (in thousands of dollars) provided the following regression output. Where .
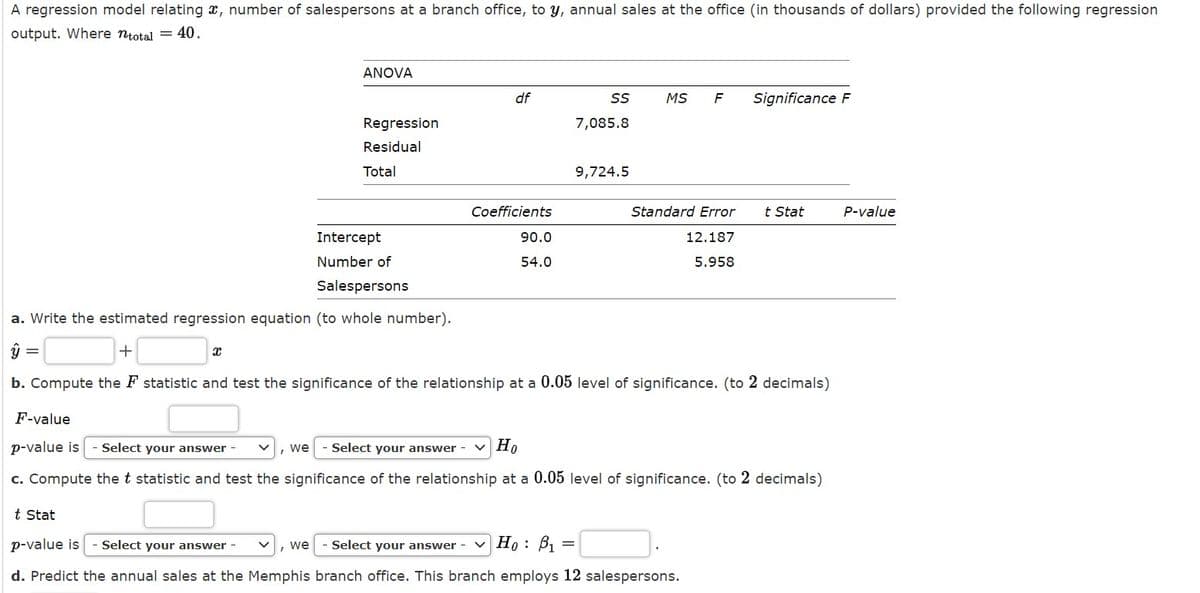
Transcribed Image Text:A regression model relating x, number of salespersons at a branch office, to y, annual sales at the office (in thousands of dollars) provided the following regression
output. Where ntotal = 40.
ANOVA
df
MS
F
Significance F
Regression
7,085.8
Residual
Total
9,724.5
Coefficients
Standard Error
t Stat
P-value
Intercept
90.0
12.187
Number of
54.0
5.958
Salespersons
a. Write the estimated regression equation (to whole number).
y =
b. Compute the F statistic and test the significance of the relationship at a 0.05 level of significance. (to 2 decimals)
F-value
p-value is
Select your answer
we
Select your answer
v Ho
c. Compute the t statistic and test the significance of the relationship at a 0.05 level of significance. (to 2 decimals)
t Stat
p-value is
- Select your answer -
, we
- Select your answer
v Ho : B1
d. Predict the annual sales at the Memphis branch office. This branch employs 12 salespersons.
Expert Solution
This question has been solved!
Explore an expertly crafted, step-by-step solution for a thorough understanding of key concepts.

This is a popular solution!

Trending now
This is a popular solution!

Step by step
Solved in 5 steps

Recommended textbooks for you
Trigonometry (MindTap Course List)
Trigonometry
ISBN:
9781305652224
Author:
Charles P. McKeague, Mark D. Turner
Publisher:
Cengage Learning
Trigonometry (MindTap Course List)
Trigonometry
ISBN:
9781305652224
Author:
Charles P. McKeague, Mark D. Turner
Publisher:
Cengage Learning