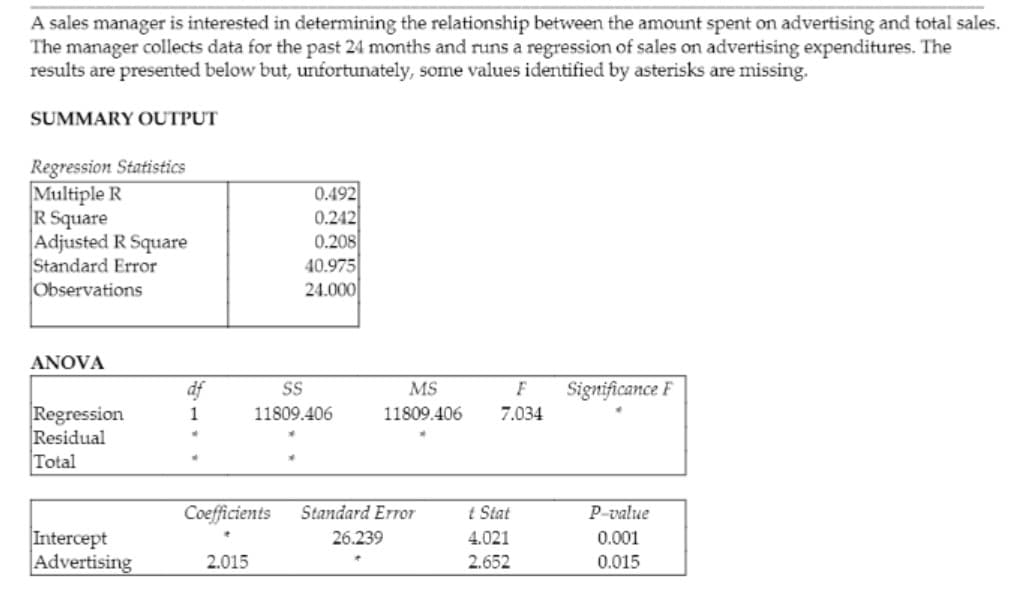
A sales manager is interested in determining the relationship between the amount spent on advertising and total sal The manager collects data for the past 24 months and runs a regression of sales on advertising expenditures. The results are presented below but, unfortunately, some values identified by asterisks are missing. SUMMARY OUTPUT Regression Statistics Multiple R R Square Adjusted R Square Standard Error Observations 0.492 0.242 0.208 40.975 24.000 ANOVA df MS F Significance F Regression Residual Total 1 11809.406 11809.406 7.034 Coefficients Standard Error t Stat P-value Intercept Advertising 26.239 4.021 0.001 2.015 2.652 0.015


Inverse Normal Distribution
The method used for finding the corresponding z-critical value in a normal distribution using the known probability is said to be an inverse normal distribution. The inverse normal distribution is a continuous probability distribution with a family of two parameters.
Mean, Median, Mode
It is a descriptive summary of a data set. It can be defined by using some of the measures. The central tendencies do not provide information regarding individual data from the dataset. However, they give a summary of the data set. The central tendency or measure of central tendency is a central or typical value for a probability distribution.
Z-Scores
A z-score is a unit of measurement used in statistics to describe the position of a raw score in terms of its distance from the mean, measured with reference to standard deviation from the mean. Z-scores are useful in statistics because they allow comparison between two scores that belong to different normal distributions.
Data is given


Trending now
This is a popular solution!

Step by step
Solved in 2 steps with 2 images


