A report just came out that stated that 21.3% of all Americans say that vanilla is their favorite ice cream, 23.1% say that chocolate is their favorite, 9.1% favor butter pecan, 10% favor strawberry, and the rest have other favorites. An ice cream shop owner thinks that her customers are not like the rest of America. The table below shows the results of 905 of her patrons' ice cream selections. What can be concluded at the a = 0.05 significance level? a. Complete the table by filling in the expected frequencies. Round your answers to the nearest whole number. Frequencies of Favorite Ice Cream Frequency Expected Frequency Outcome Vanilla 172
A report just came out that stated that 21.3% of all Americans say that vanilla is their favorite ice cream, 23.1% say that chocolate is their favorite, 9.1% favor butter pecan, 10% favor strawberry, and the rest have other favorites. An ice cream shop owner thinks that her customers are not like the rest of America. The table below shows the results of 905 of her patrons' ice cream selections. What can be concluded at the a = 0.05 significance level? a. Complete the table by filling in the expected frequencies. Round your answers to the nearest whole number. Frequencies of Favorite Ice Cream Frequency Expected Frequency Outcome Vanilla 172

Algebra & Trigonometry with Analytic Geometry
13th Edition
ISBN:9781133382119
Author:Swokowski
Publisher:Swokowski
Chapter10: Sequences, Series, And Probability
Section10.7: Distinguishable Permutations And Combinations
Problem 30E

Related questions
Question
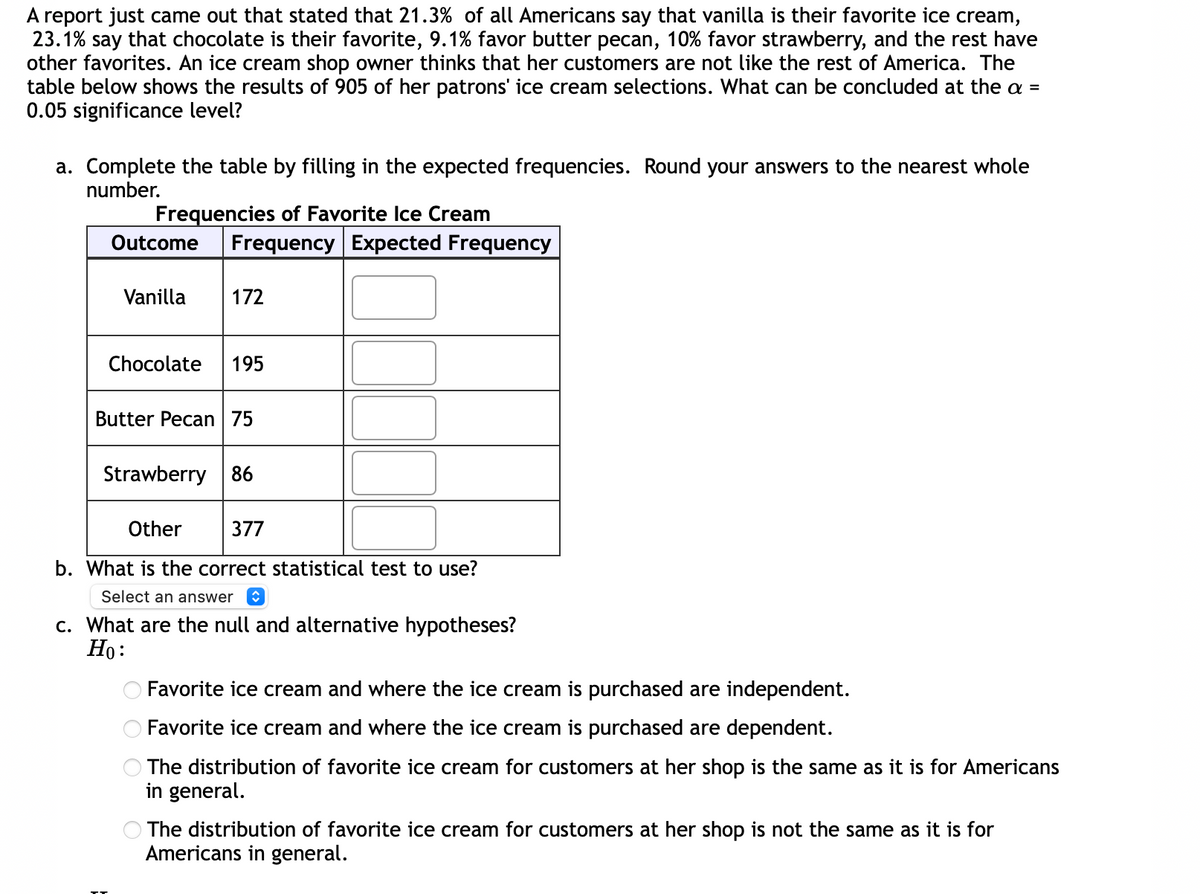
Transcribed Image Text:A report just came out that stated that 21.3% of all Americans say that vanilla is their favorite ice cream,
23.1% say that chocolate is their favorite, 9.1% favor butter pecan, 10% favor strawberry, and the rest have
other favorites. An ice cream shop owner thinks that her customers are not like the rest of America. The
table below shows the results of 905 of her patrons' ice cream selections. What can be concluded at the a =
0.05 significance level?
a. Complete the table by filling in the expected frequencies. Round your answers to the nearest whole
number.
Frequencies of Favorite Ice Cream
Frequency Expected Frequency
Outcome
Vanilla
172
Chocolate
195
Butter Pecan 75
Strawberry
86
Other
377
b. What is the correct statistical test to use?
Select an answer
c. What are the null and alternative hypotheses?
Но:
Favorite ice cream and where the ice cream is purchased are independent.
Favorite ice cream and where the ice cream is purchased are dependent.
The distribution of favorite ice cream for customers at her shop is the same as it is for Americans
in general.
The distribution of favorite ice cream for customers at her shop is not the same as it is for
Americans in general.
Expert Solution
This question has been solved!
Explore an expertly crafted, step-by-step solution for a thorough understanding of key concepts.

This is a popular solution!

Trending now
This is a popular solution!

Step by step
Solved in 2 steps

Recommended textbooks for you
Algebra & Trigonometry with Analytic Geometry
Algebra
ISBN:
9781133382119
Author:
Swokowski
Publisher:
Cengage

Linear Algebra: A Modern Introduction
Algebra
ISBN:
9781285463247
Author:
David Poole
Publisher:
Cengage Learning
Algebra & Trigonometry with Analytic Geometry
Algebra
ISBN:
9781133382119
Author:
Swokowski
Publisher:
Cengage
Linear Algebra: A Modern Introduction
Algebra
ISBN:
9781285463247
Author:
David Poole
Publisher:
Cengage Learning