
MATLAB: An Introduction with Applications
6th Edition
ISBN: 9781119256830
Author: Amos Gilat
Publisher: John Wiley & Sons Inc
expand_more
expand_more
format_list_bulleted
Concept explainers
Topic Video
Question

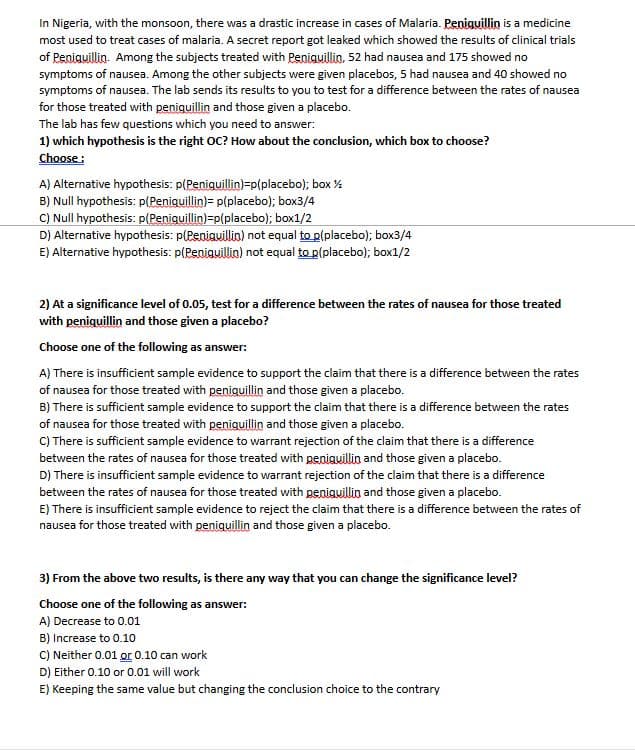
Transcribed Image Text:In Nigeria, with the monsoon, there was a drastic increase in cases of Malaria. Peniguillin is a medicine
most used to treat cases of malaria. A secret report got leaked which showed the results of clinical trials
of Peniquillin. Among the subjects treated with Peniguillin, 52 had nausea and 175 showed no
symptoms of nausea. Among the other subjects were given placebos, 5 had nausea and 40 showed no
symptoms of nausea. The lab sends its results to you to test for a difference between the rates of nausea
for those treated with peniguillin and those given a placebo.
The lab has few questions which you need to answer:
1) which hypothesis is the right OC? How about the conclusion, which box to choose?
Choose :
Expert Solution

This question has been solved!
Explore an expertly crafted, step-by-step solution for a thorough understanding of key concepts.
Step by stepSolved in 2 steps with 4 images

Knowledge Booster
Learn more about
Need a deep-dive on the concept behind this application? Look no further. Learn more about this topic, statistics and related others by exploring similar questions and additional content below.Similar questions
- The U.S. Department of Transportation, National Highway Traffic Safety Administration, reported that 77% of all fatally injured automobile drivers were intoxicated. A random sample of 26 records of automobile driver fatalities in Kit Carson County, Colorado, showed that 14 involved an intoxicated driver. Do these data indicate that the population proportion of driver fatalities related to alcohol is less than 77% in Kit Carson County? Use ? = 0.01. Solve the problem using both the traditional method and the P-value method. Since the sampling distribution of p̂ is the normal distribution, you can use critical values from the standard normal distribution as shown in the table of critical values of the z distribution. (Round the test statistic and the critical value to two decimal places. Round the P-value to four decimal places.) test statistic = critical value = P-value =arrow_forwardI can’t get the right answer . Please show me how you get it. In previous questions you just wrote solved by excel and i don’t know what that means. It doesn’t help me learnarrow_forwardBurning fuels in power plants and motor vehicles emits carbon dioxide (CO2), which contributes to global warming. The CO2 emissions (metric tons per capita) for countries varies from 0.02 in Burundi to 44.02 in Qatar. Although the data set includes 214 countries, the CO2 emissions of 15 countries are not available on the World Bank database. The data set is too large to display but the data for the first five countries is given. Use the full data set with data on the 214 countries to answer the questions. To access the complete data set, click the link for your preferred software format: Excel Minitab JMP SPSS TI R Mac-TXT PC-TXT CSV Crunchlt! Country CO2 Emissions (Metric Tons per Capita) Aruba 23.92 Andorra 5.97 Afghanistan 0.43 Angola 1.35 Albania 1.61 Find the mean and the median for the full data set. Round your answers to three decimal places. The mean for these data is tons per person The median for these data is tons per personarrow_forward
- A recent study claims that 40% of registered voters associate themselves with Democrats. 35% with Republicans, 20% Independent, 3% Green party, and 2% with Social democrats. In a sample of 400 individuals, we observed Actual 200 Democrats 150 Republicans 25 Independent 15 Green Party 10 Social Democrats Test the claim at a=0.05.arrow_forwardThe percentage of people in the population suffering from a certain disease is 32%. There is a test to detect the disease that is quite accurate. Of the people who have the disease and who undergo the test, it is indicated that 2% of them do not have the disease. Of the people who do not have the disease and who undergo the test, 2% of them are reported to have the disease. Suppose a person takes the test and indicates that they have the disease. Find the probability that the person does have the disease. Round your answer to two decimal places.arrow_forwardAn article stated that last year 807 people taking a certain medication suffered from serious side effects while this year, after medication had been modified, only 391 suffered serious side effects. What information is missing? Why would it be important to include this information?arrow_forward
- A new cold medication claims that, on average, individuals who take the medication recover within 5 days. Dr. Nelson believes the recovery time is longer. She surveys 31 people with colds who take the medication. She finds that their recovery time, in days, is as follows: 7, 5, 4, 8, 5, 5, 4, 4, 5, 5, 6, 4, 4, 5, 4, 7, 5, 7, 4, 6, 4, 3, 5, 7, 8, 4, 7, 4, 6, 4, 6 Perform a hypothesis test using a 9% level of significance. Step 1: State the null and alternative hypotheses. H.: pv >v (So we will be performing a right-tailed Vv test.) Step 2: Assuming the null hypothesis is true, determine the features of the distribution of point estimates using the Central Limit Theorem. By the Central Limit Theorem, we know that the point estimates are t-distributed v with distribution mean and distribution standard deviation Step 3: Find the p-value of the point estimate. P( 2v = P(tv 2v %3D p-value = Step 4: Make a Conclusion About the null hypothesis. Since the p-value = = a, we do not reject the…arrow_forwardYou develop a new vaccine for HPV and want to know if the effectiveness is different in men and women (biology note: there are many, many viruses which can cause HPV symptoms). You give the vaccine to 45 men and 63 women. After several years you find that 12 men came down with HPV and 27 women came down with HPV. Is there a difference in effectiveness between men and women? Again, give both the test statistic and the table value. Use α = 0.05 and make sure you give H0, H1, etc.. State your conclusionarrow_forwardAn aerosolized vaccine for measles was developed in Mexico and has been used on 44 million children since 1980. Aerosolized vaccines have the advantages of being able to be administered by people without clinical training and do not cause injection‐associated infections. The percentage of children developing an immune response to measles after receiving the subcutaneous injection of the vaccine is 95%,95%, and for those receiving the aerosolized vaccine, it is 85%85% . There are 2020 children to be vaccinated for measles using the aerosolized vaccine in a small rural village in India. We are going to count the number who developed an immune response to measles after the vaccination. What would be the probability that at least one child does not develop an immune response to measles if all children were vaccinated using the subcutaneous injection of the vaccine? (Enter your answer as a proportion rounded to four decimal places.)arrow_forward
- Suppose you are conducting a paired t test to determine whether or not caffeine has an effect on heart rate. You have a sample of 60 participants and they ingest no caffeine each day for a week. At the end of the week, you measure their heart rates and find the mean. Then, the same 60 participants are given 500mg of caffeine every day for a week and again, at the end of the week you measure their heart rates and find the mean. What would the null hypothesis be for this test?arrow_forwardA special education teacher did research on whether or not there is a relationship between the number of students in his class and the number incidents of “acting out” behaviors exhibited by the autistic students in the classroom. He collects data for a year and aggregates them by month. He obtained the statistics below, r= -.863 R2=.74 b= -1.212294 a= 131.176598 10.) How does the presence of more students affect the incidents in the class? a) as students are added the incidences increase b) as students are added the incidences decrease c) the number of students does not affect acting out d) the number of students caused more incidents How much of the variability of acting out is explained by the number of students in the class?___________arrow_forwardMs. Fit investigates whether children exhibit a higher number of prosocial acts after watching a 30-minute cartoon containing multiple prosocial acts in comparison to watching a 30-minute educational cartoon. Before watching the cartoon, children were matched on empathy (as rated by one of their parents) and then one of each pair was assigned to either the prosocial cartoon or the educational cartoon. The number of prosocial acts for the children was analyzed and resulted in the output below. Write a directional alternative hypothesis. Identify the IV, its levels, and its scale of measurement. Identify the DV and its scale of measurement. Identify one limitation in the design of this specific study (not just this type of design). Explain why it is a limitation and suggest how a future study could avoid it. What specific procedures should the research have followed to ensure that the study is ethical? Explain your answer.arrow_forward
arrow_back_ios
SEE MORE QUESTIONS
arrow_forward_ios
Recommended textbooks for you
- MATLAB: An Introduction with ApplicationsStatisticsISBN:9781119256830Author:Amos GilatPublisher:John Wiley & Sons IncProbability and Statistics for Engineering and th...StatisticsISBN:9781305251809Author:Jay L. DevorePublisher:Cengage LearningStatistics for The Behavioral Sciences (MindTap C...StatisticsISBN:9781305504912Author:Frederick J Gravetter, Larry B. WallnauPublisher:Cengage Learning
- Elementary Statistics: Picturing the World (7th E...StatisticsISBN:9780134683416Author:Ron Larson, Betsy FarberPublisher:PEARSONThe Basic Practice of StatisticsStatisticsISBN:9781319042578Author:David S. Moore, William I. Notz, Michael A. FlignerPublisher:W. H. FreemanIntroduction to the Practice of StatisticsStatisticsISBN:9781319013387Author:David S. Moore, George P. McCabe, Bruce A. CraigPublisher:W. H. Freeman

MATLAB: An Introduction with Applications
Statistics
ISBN:9781119256830
Author:Amos Gilat
Publisher:John Wiley & Sons Inc

Probability and Statistics for Engineering and th...
Statistics
ISBN:9781305251809
Author:Jay L. Devore
Publisher:Cengage Learning

Statistics for The Behavioral Sciences (MindTap C...
Statistics
ISBN:9781305504912
Author:Frederick J Gravetter, Larry B. Wallnau
Publisher:Cengage Learning

Elementary Statistics: Picturing the World (7th E...
Statistics
ISBN:9780134683416
Author:Ron Larson, Betsy Farber
Publisher:PEARSON

The Basic Practice of Statistics
Statistics
ISBN:9781319042578
Author:David S. Moore, William I. Notz, Michael A. Fligner
Publisher:W. H. Freeman

Introduction to the Practice of Statistics
Statistics
ISBN:9781319013387
Author:David S. Moore, George P. McCabe, Bruce A. Craig
Publisher:W. H. Freeman