A report states that adults 18- to 24- years-old send and receive 128 texts every day. Suppose we take a sample of 25- to 34- year-olds to see if their mean number of daily texts diff from the mean for 18- to 24- year-olds. (a) State the null and alternative hypotheses we should use to test whether the population mean daily number of texts for 25- to 34-year-olds differs from the population daily mea number of texts for 18- to 24-year-olds. (Enter != for # as needed.) Ho: H: (b) Suppose a sample of thirty 25- to 34-year-olds showed a sample mean of 118.8 texts per day. Assume a population standard deviation of 33.17 texts per day. Compute the p-value. (Round your answer to four decimal places.) p-value = (c) With a = 0.05 as the level of significance, what is your conclusion? O Reject Ho. We can conclude that the population mean daily texts for 25- to 34-year-olds differs significantly from the population mean of 128 daily texts for 18- 24-year-ole O Do not reject Ho. We cannot conclude that the population mean daily texts for 25- to 34-year-olds differs significantly from the population mean of 128 daily texts for 18- year-olds. O Do not reject Ho. We can conclude that the population mean daily texts for 25- to 34-year-olds differs significantly from the population mean of 128 daily texts for 18- 24-y olds. O Reject Ho. We cannot conclude that the population mean daily texts for 25- to 34-year-olds differs significantly from the population mean of 128 daily texts for 18- 24-year
A report states that adults 18- to 24- years-old send and receive 128 texts every day. Suppose we take a sample of 25- to 34- year-olds to see if their mean number of daily texts diff from the mean for 18- to 24- year-olds. (a) State the null and alternative hypotheses we should use to test whether the population mean daily number of texts for 25- to 34-year-olds differs from the population daily mea number of texts for 18- to 24-year-olds. (Enter != for # as needed.) Ho: H: (b) Suppose a sample of thirty 25- to 34-year-olds showed a sample mean of 118.8 texts per day. Assume a population standard deviation of 33.17 texts per day. Compute the p-value. (Round your answer to four decimal places.) p-value = (c) With a = 0.05 as the level of significance, what is your conclusion? O Reject Ho. We can conclude that the population mean daily texts for 25- to 34-year-olds differs significantly from the population mean of 128 daily texts for 18- 24-year-ole O Do not reject Ho. We cannot conclude that the population mean daily texts for 25- to 34-year-olds differs significantly from the population mean of 128 daily texts for 18- year-olds. O Do not reject Ho. We can conclude that the population mean daily texts for 25- to 34-year-olds differs significantly from the population mean of 128 daily texts for 18- 24-y olds. O Reject Ho. We cannot conclude that the population mean daily texts for 25- to 34-year-olds differs significantly from the population mean of 128 daily texts for 18- 24-year

Glencoe Algebra 1, Student Edition, 9780079039897, 0079039898, 2018
18th Edition
ISBN:9780079039897
Author:Carter
Publisher:Carter
Chapter10: Statistics
Section10.4: Distributions Of Data
Problem 19PFA

Related questions
Topic Video
Question
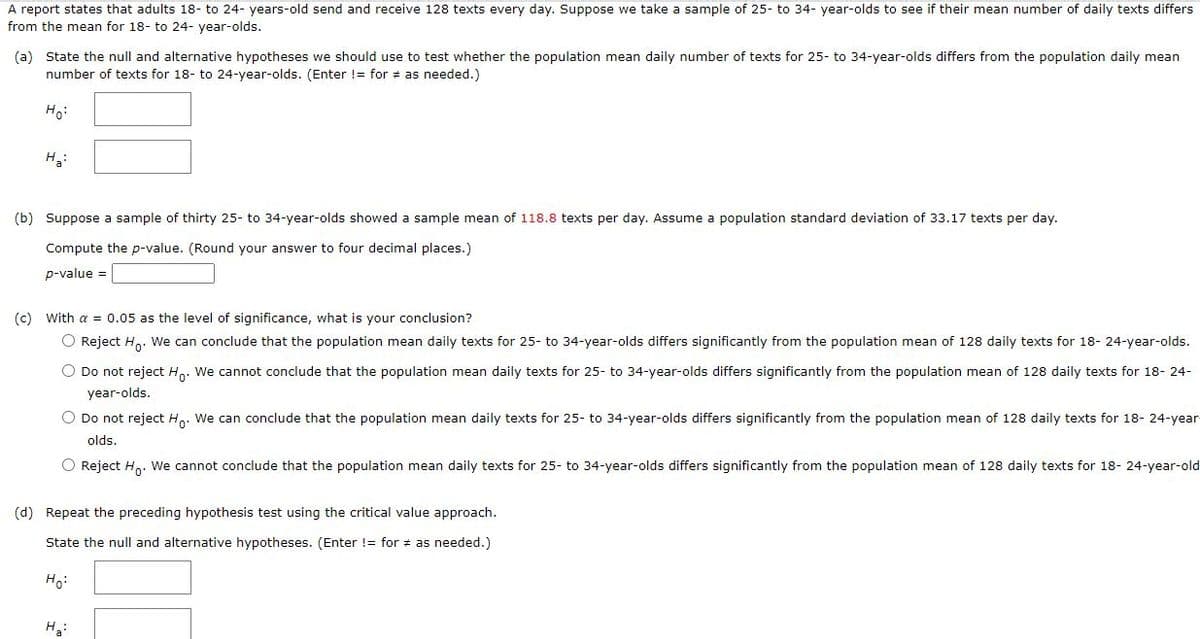
Transcribed Image Text:A report states that adults 18- to 24- years-old send and receive 128 texts every day. Suppose we take a sample of 25- to 34- year-olds to see if their mean number of daily texts differs
from the mean for 18- to 24- year-olds.
(a) State the null and alternative hypotheses we should use to test whether the population mean daily number of texts for 25- to 34-year-olds differs from the population daily mean
number of texts for 18- to 24-year-olds. (Enter != for # as needed.)
Ho:
H3:
(b) Suppose a sample of thirty 25- to 34-year-olds showed a sample mean of 118.8 texts per day. Assume a population standard deviation of 33.17 texts per day.
Compute the p-value. (Round your answer to four decimal places.)
p-value =
(c) With a = 0.05 as the level of significance, what is your conclusion?
O Reject H,. We can conclude that the population mean daily texts for 25- to 34-year-olds differs significantly from the population mean of 128 daily texts for 18- 24-year-olds.
O Do not reject Ho. We cannot conclude that the population mean daily texts for 25- to 34-year-olds differs significantly from the population mean of 128 daily texts for 18- 24-
year-olds.
O Do not reject Ho. We can conclude that the population mean daily texts for 25- to 34-year-olds differs significantly from the population mean of 128 daily texts for 18- 24-year
olds.
O Reject H. We cannot conclude that the population mean daily texts for 25- to 34-year-olds differs significantly from the population mean of 128 daily texts for 18- 24-year-old
(d) Repeat the preceding hypothesis test using the critical value approach.
State the null and alternative hypotheses. (Enter != for # as needed.)
Ho:
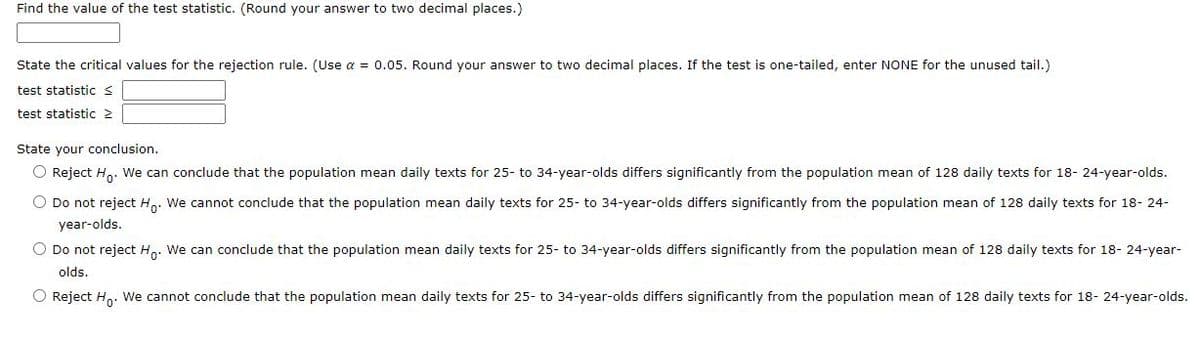
Transcribed Image Text:Find the value of the test statistic. (Round your answer to two decimal places.)
State the critical values for the rejection rule. (Use a = 0.05. Round your answer to two decimal places. If the test is one-tailed, enter NONE for the unused tail.)
test statistic s
test statistic 2
State your conclusion.
O Reject H. We can conclude that the population mean daily texts for 25- to 34-year-olds differs significantly from the population mean of 128 daily texts for 18- 24-year-olds.
O Do not reject H,. We cannot conclude that the population mean daily texts for 25- to 34-year-olds differs significantly from the population mean of 128 daily texts for 18- 24-
year-olds.
O Do not reject Ho. We can conclude that the population mean daily texts for 25- to 34-year-olds differs significantly from the population mean of 128 daily texts for 18- 24-year-
olds.
O Reject H,. We cannot conclude that the population mean daily texts for 25- to 34-year-olds differs significantly from the population mean of 128 daily texts for 18- 24-year-olds.
Expert Solution
This question has been solved!
Explore an expertly crafted, step-by-step solution for a thorough understanding of key concepts.

This is a popular solution!

Trending now
This is a popular solution!

Step by step
Solved in 2 steps with 1 images

Knowledge Booster


Learn more about
Need a deep-dive on the concept behind this application? Look no further. Learn more about this topic, statistics and related others by exploring similar questions and additional content below.Recommended textbooks for you
Glencoe Algebra 1, Student Edition, 9780079039897…
Algebra
ISBN:
9780079039897
Author:
Carter
Publisher:
McGraw Hill

College Algebra (MindTap Course List)
Algebra
ISBN:
9781305652231
Author:
R. David Gustafson, Jeff Hughes
Publisher:
Cengage Learning
Glencoe Algebra 1, Student Edition, 9780079039897…
Algebra
ISBN:
9780079039897
Author:
Carter
Publisher:
McGraw Hill
College Algebra (MindTap Course List)
Algebra
ISBN:
9781305652231
Author:
R. David Gustafson, Jeff Hughes
Publisher:
Cengage Learning